
|
|
|
|
| |
 Editorial Editorial |
|
The present issue of the WaterStrategyMan
Newsletter presents the WSM Decision Support System and the GIS
Database, which are the main research outcomes of the
Analysis Phase of the Project. The work
effort of the Analysis Phase concerned the review and adaptation of existing
methodologies and their integration in a GIS Decision
Support System, to be used in the Case Study analyses of the
Strategy Formulation Phase.
The system is currently being applied to the Case Study
Regions of the WSM Project, which are Paros Island in Cyclades,
Greece, Belice Basin in Sicily, Italy, Tel
Aviv and Arava regions in Israel, Limassol area in
Cyprus, Tenerife in Canary Islands, Spain, and
Ribeiras do
Algarve in Portugal.
The primary goal of the developed GIS
Decision Support System is to assess the state of a water
resources system in terms of sources, usage, water cycles
(pathways) and environmental quality in a simulation
environment that responds realistically to different
instruments. In this context, the DSS can
compare water management strategies or single interventions
under different scenarios, and assist in the formulation of
coherent responses for the mitigation of water stress
impacts.
The economic issues and the
methodology incorporated in the WSM
Decision Support System will be
addressed in the next issue of the
WaterStrateyMan Newsletter
(July-September 2004).
The documents accompanying this Issue of
the Newsletter present the architecture of the system and
of
the GIS Database, as well as the implementation of the
methodologies for the modelling and simulation of water
systems. |
|
|
|
The
WaterStrategyMan
Project (Developing Strategies for Regulating and Managing
Water Resources and Demand in Water Deficient Regions / WSM),
is supported by the European Commission under the
Fifth
Framework Programme, under the Key Action
"Sustainable Management and Quality of Water". |
|
|
|
|
|
|
|
Overview of the WaterStrategyMan Decision Support System
|
|
|
|
The WSM DSS is based on the concept of a water
management scheme (WMS).
Conceptually, a WMS is defined as a set of scenarios for variables that
cannot be directly influenced by the decision maker (i.e. rainfall
patterns constituting a water availability scenario and population
growth formulating a demand scenario) and the application of one or more
water management interventions. The latter can be coherently articulated
in space and time, formulating a strategy.
Operationally, a WMS is defined in terms of a
GIS database containing information on the water infrastructure at a certain
region and reference year. The reference year serves as the basis for
scenario assumptions and implementation of strategies. |
A base
case is always present, serving as input for the creation of new WMSs.
User interaction with the DSS falls under three functional groups,
accessed via a hierarchical navigation tree (see Figure 1): (a) base case editing, allowing for the
editing and introduction of new data for the reference year; (b) creation of WMSs,
providing the capabilities for defining scenarios on water availability
and demand, definition of strategies and visualization of the simulation results.
Additional functionalities permit the carrying out of a parametric
economic analysis, for the estimation of direct, environmental and
resource costs, and (c) evaluation, which permits the comparison of different WMSs
according to a predefined set of indicators.
|
|
|
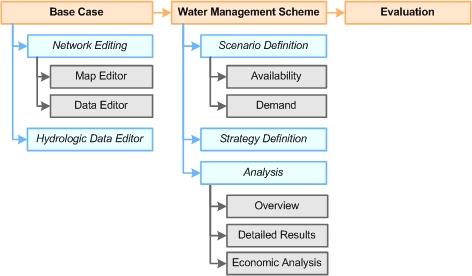
Figure 1. The WSM DSS operational framework
|
|
Water availability scenarios
can be formulated in two ways, depending on the type of available
information. The first approach uses real observations at existing
monitoring stations. Scenarios are formulated through the creation of
customized "hydrological" years, having a monthly positive or negative rate with
respect to the normal one. The second option performs a water balance
based upon monthly meteorological data on rainfall and temperature, and
on soil and land use characteristics of the region. The algorithm
starts from the generation of temperature, evapotranspiration and
rainfall scenarios and computes water balance at watershed level for
each sub-basin identified from the Digital Elevation Model of the area.
The
Demand Scenarios Module produces
forecasted time-series of water demand for all uses, generated by
specifying appropriate growth rates to the key variables that
govern demand pressures, such as population for domestic use, cultivable
area and livestock for agricultural practices, production growth for
industries and minimum required energy production from hydropower
plants. |
Application of water management instruments can be realised either
through proper customization of "abstract" actions, or through
modification of the properties of network objects and the introduction
of new ones. As an example, supply regulation through quotas can be
performed through application of the respective action, where the user
defines the maximum volume of demand that can be met under a specified
time period, and the geographic area of application.
The
Analysis branch provides the visualization of results from the
simulation of each water management scheme, through three functions. The
Overview displays yearly aggregated results on water demand and shortage
for the main sectors, freshwater abstractions, and costs (direct and
environmental) as well as benefits from water use. The Detailed Results
section provides the results of the
Water Allocation in terms of appropriately
customized indicators aggregated either for the entire region or
presented for each type of network object.
An example of the interface
of the DSS is presented in Figure 2.
|
|
Figure 2. The Detailed Results interface of the Decision Support
System
(Click
here to view an enlarged image of the screenshot) |
|
The
Economic Analysis branch,
incorporated in the Analysis Output, permits the selection of appropriate models
and parameters for the estimation of direct, environmental and resource
costs and the definition of benefits from water uses, while avoiding
repetition of the entire simulation procedure. |
Finally, in the
Evaluation part, schemes are ranked according to
their performance in a predefined set of indicators that aim to
conceptualize various aspects of the three principles of Integrated
Water Resources Management, economic efficiency, equitability and
environmental sustainability. |
|
|
|
|
|
|
|
|