Appendix
Glossary of terms and definitions
Falkenmark Water Stress Indicator
(Resources to population index)
Dry season flow by river basin
Water availability index WAI
Basic Human Needs Index
Index of water scarcity
Vulnerability of Water Systems
Environmental Sustainability Index (ESI)
Water Poverty Index (WPI)
Water resources
indicators, applicable scales and data requirements
PSR Approach
DPSIR Approach
CSD Working List of Indicators of
Sustainable Development
OECD environmental indicators
European System of Environmental Pressure
Indices (EPI)
Plan Bleu
WFD Classification
The WSM - DSS Approach
Web Links for further reading
Glossary of terms and definitions
|
Actual
external renewable water resources |
Part
of the external water resources that is available, taking into consideration
the quantity of flows reserved to upstream and downstream countries through
formal or informal agreements or treaties. |
|
Annual
water withdrawals |
Amount
of water that is abstracted from surface or groundwater resources by water
companies (public water supply) or directly by water consumers. |
|
Consumptive
use |
Water
that is abstracted and not longer available for use because it has
evaporated, transpired, been incorporated into products and crops, consumed
by man or livestock, ejected directly to the sea, or otherwise removed from
freshwater resources. |
|
Dependency
Ratio |
Measures
the dependence of a region on external water being computed as the total
volume of external water flows (importing and inflows) over the total volume
of water produced on a yearly basis. |
|
Demand
coverage |
Describes
the relative coverage of water demand for a given secto |
|
Consumption
Index |
Consumptive
use/Total water production |
|
External
renewable water resources ERWR |
Part
of the renewable water resources coming from outside the country or shared
with neighbouring countries. |
|
Internal
renewable water resources IRWR |
Average
annual flow of rivers and recharge of groundwater generated from endogenous
precipitation. |
|
Non-sustainable
Water production index |
Measures
the amount of water that is abstracted in excess of the sources’ recharge on
a yearly basis as a fraction of the total water abstractions. For groundwater
it is based on the concept of sustainable yield which is defined as the
quantity that can be extracted from an aquifer on a sustainable basis. |
|
Exploitation
Index |
Measures
the relative pressure of annual production on groundwater resources; Sum of
the volumes of annual conventional renewable natural freshwater production
for all uses including all loses over the volume of average annual flows of
renewable groundwater resources (recharge). |
|
Sustainable
yield of aquifers |
Quantity
that can be extracted from an aquifer on a sustainable basis. Theoretically,
the sustainable yield is equal to recharge but it is in most cases considered
less than recharge as it must also allow for adequate provision of water to
sustain streams, springs, wetlands and groundwater dependent ecosystems.
Abstractions from renewable groundwater are therefore considered to be
unsustainable if the yearly amount abstracted exceeds the amount of recharge
multiplied by a factor that allows for such needs |
|
Surface
runoff |
Average
annual flow of rivers. |
|
Global
renewable water resources GRWR |
Long-term
average precipitation minus long-term average evapotranspiration plus
long-term average incoming flow originating outside the country/region/basin |
|
Transboundary
water |
see:
external renewable water resources |
|
Unconventional
water resources |
The
sum of desalinated water resources and reused treated wastewater. |
Falkenmark Water Stress Indicator (Resources to population index)
When describing water availability
in a country, the Falkenmark Water Stress Indicator, which was developed by the
Swedish water expert Falkenmark in 1989, is one of the most commonly used indicators.
Originally, the indicator based on the estimation that a flow unit of one
million cubic metres of water can support 2,000 people in a society with a
high level of development, using Israel as a reference by calculating the total
annual renewable water resources per capita. Water availability of more than
1,700m³/capita/year is defined as the threshold above which water shortage
occurs only irregularly or locally. Below this level, water scarcity arises in
different levels of severity. Below 1,700m³/capita/year water stress appears
regularly, below 1,000m³/capita/year water scarcity is a limitation to economic
development and human health and well-being, and below 500m³/capita/year water
availability is a main constraint to life.
Despite its global acceptance, this
indicator has numerous shortcomings. First of all, only the renewable surface
and groundwater flows in a country are considered. Moreover, the water
availability per person is calculated as an average with regard to both the
temporal and the spatial scale and thereby neglects water shortages in dry
seasons or in certain regions within a country.
Furthermore, it does not take the
water quality into account at all nor does it give information about a
country’s ability to use the resources. Even if a country has sufficient water
according to the Falkenmark indicator, these water resources possibly cannot be
used because of pollution or insufficient access to them. Values of water
availability and water demand for selected countries are depicted in the figure
below.
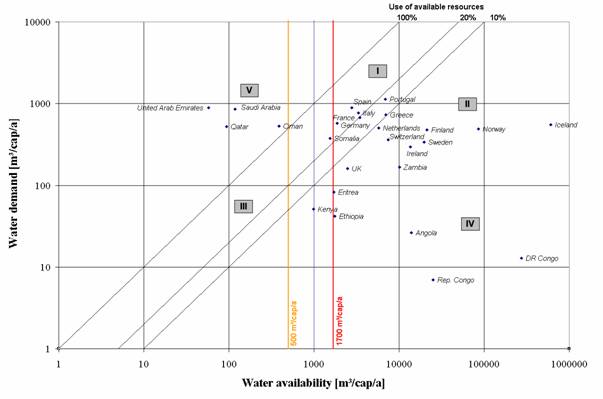
Falkenmark Water Stress Index for
selected countries
Dry season flow by river basin
This indicator was developed by the
World Resources Institute (WRI) as part of the Pilot Analysis of Global
Ecosystems (PAGE) (WRI, 2000) for the description of water conditions on a
river basin level. It considers the temporal variability of water availability
that is essential for example in regions with rainy and dry seasons. Watersheds
with a dry season are those where less than 2% of the surface runoff is
available in the 4 driest months of the year. This indicator is calculated by
dividing the volume of runoff during the dry season, i.e. during the four
consecutive months with the lowest cumulative runoff, by the population. Based
on the Falkenmark definition, a basin is water stressed if less than
1,700m³/year/person is available, and amounts between 1,700m³/year/person and
4,000m³/year/person indicate adequate supply of water.
This indicator does of course not represent an overall picture of the water resources conditions because it depicts only the water availability. But as it takes the temporal variability of water resources into account, it can serve as one part of a more complex index.
Meigh et al. (1999) took in their GWAVA (Global Water
AVailability Assessment) model the temporal variability of water availability
into account. The index includes surface water as well as groundwater
resources, and compares the total amount to the demands of all sectors, i.e.
domestic, industrial and agricultural demands. The month with the maximum
deficit or minimum surplus respectively is decisive. The index is normalised to
the range –1 to +1.
When the index is zero, availability and demands are
equal.
with R = surface runoff, G = groundwater resources and D =
sum of demands of all sectors.
The surface water availability is calculated as the 90%
reliable runoff. The groundwater availability is estimated either as the
potential recharge that is calculated from the monthly surface water balance,
or as the potential aquifer yield, and the lower figure is considered in the
calculation.
This approach is based on the use
of water instead of water availability. Gleick (1996) quantified the amount of
water that a person needs for basic water requirements (BWR), such as drinking,
cooking, bathing, sanitation and hygiene, as 50 litres per person per day.
According to this definition, estimates of the number of countries where the
average domestic water use is below this threshold are made.
This indicator is only calculated on country-level so that regional water scarcity is not depicted. Again, water quality is not included into the concept. Furthermore, country data about the domestic water use are insufficient and unreliable, and the needs of other water users, such as the industry, agriculture or nature itself, are not included at all into the approach.
An indicator that combines
information about water abstractions and water availability is the index of
water scarcity. It is defined by the intensity of use of water resources, i.e.
the gross freshwater abstractions as percentage of the total renewable water
resources or as percentage of internal water resources.
Heap et al. (1998) added the
variable of desalinated water resources to this indicator. The share of
desalinated water use is insignificant on the global scale, but it is crucial
in some regions, as for example in the
![]()
where RWS is the water scarcity
index, W are the annual freshwater abstractions, S are the desalinated water
resources and Q is the annual available water which is calculated by
![]()
where R are the internal water
resources in the country, Dup is the amount of external water resources and α
is the ratio of the external water resources that can be used. The factor α is
influenced by the quality of the transboundary water, the real consumption of
water resources in the upstream region, and the accessibility of water.
The severity of water stress is
classified by
RWS < 0.1 no water stress
0.1 < RWS < 0.2 low water stress
0.2 < RWS < 0.4 moderate water stress
0.4 < RWS high water stress
Again, this indicators neglects
temporal and spatial variations as well as water quality data.
Vulnerability of Water Systems
Gleick (1990) developed this index
for watersheds in the
It describes the vulnerability of
water resources systems based on the five criteria and corresponding thresholds
that are briefly described below. These five indicators are not aggregated to
an overall index but for each region the number of vulnerable sections is
presented. This approach emphasises the sectors of watersheds that are
threatened.
· Storage volume relative to total renewable water resources
A basin is defined as vulnerable if
the storage capacity is less than 60 % of the total renewable water resources.
· Consumptive use relative to total renewable water resources
The threshold for vulnerability is
a ratio of 0.2
· Proportion of hydroelectricity relative to total electricity
If the part of hydroelectricity is
more than 25 %, the region is considered vulnerable.
· Groundwater overdraft relative to total groundwater withdrawals
Regions with a ratio above 0.25 are
defined as vulnerable.
· Variability of flow
This indicator is calculated by
dividing the surface runoff exceeded only 5 % of the time by the quantity
exceeded 95 % of the time. A low ratio indicates a low variability of runoff
and by that a low risk of both floods and droughts. A variability value above 3
indicates vulnerability in this aspect.
Environmental Sustainability Index (ESI)
|
Category |
Indicator |
|
Resource
Depletion |
Water
consumption |
|
Inputs
of phosphate to agricultural land |
|
|
Dispersion
of Toxic Substances |
Index
of heavy metal emissions to water |
|
Emissions
of persistent organic pollutants (POPs) |
|
|
Consumption
of toxic chemicals |
|
|
Water
pollution |
Emissions
of nutrients by households |
|
Emissions
of nutrients by industry |
|
|
Pesticides
used per hectare of utilised agriculture area |
|
|
Nitrogen
quantity used per hectare of utilised agriculture area |
|
|
Emissions
of organic matter from households |
|
|
Emissions
of organic matter from industry |
|
|
Non-treated
urban waste water |
|
|
Urban
Environmental Problems |
Non-treated
urban wastewater |
|
Marine
Environment and Coastal Zones |
Tourism
intensity |
Recently, the Water Poverty Index (WPI)
(Sullivan, 2002, Lawrence et al., 2002), developed by the Centre for Ecology
and Hydrology (CEH) in
· Resources
· Access
· Use
· Capacity and
· Environment
Each of these components is derived
from two to five indicators which are normalised to a scale from
0 to 1.
In case of an equal weighting, the
subindex and component values are then calculated as a simple average of the
corresponding indicators, and this value is multiplied by 20. The overall index
is generated as a sum of the component values so that the value is between 0
and 100. A value of 100 is only possible if a country ranks best in all of the
five components.
Components of the Water Poverty
Index
|
COMPONENT |
SUBINDEX |
INDICATOR |
unit |
|
Resources |
|
internal
water resources |
km³/cap/year |
|
|
external
water resources |
km³/cap/year |
|
|
Access |
|
access
to safe water |
% |
|
|
access
to sanitation |
% |
|
|
|
access
to irrigation |
-- |
|
|
Capacity |
|
GDP
per capita |
US$ |
|
|
under-5
mortality rate |
per
1000 live births |
|
|
|
UNDP
education index |
-- |
|
|
|
Gini
coefficient |
-- |
|
|
Use |
|
domestic
water use |
l/cap/day |
|
|
industrial
water use (as: proportion of GDP derived from industry/ proportion of water
used by industry) |
-- |
|
|
|
agricultural
water use (as: proportion of GDP derived from agriculture/ proportion of
water used by agriculture) |
-- |
|
|
Environment |
water
quality |
dissolved
oxygen concentration |
mg/l |
|
phosphorus
concentration |
mg/l |
||
|
suspended
solids |
mg/l |
||
|
electrical
conductivity |
mS/cm |
||
|
water
stress |
fertiliser
consumption |
100
g |
|
|
pesticide
use |
kg |
||
|
industrial
organic pollutants |
metric
tons/ km³ |
||
|
%
of countries territory under severe water stress (according to
ESI-definition) |
% |
||
|
regulation
and management |
environmental
regulatory stringency |
-- |
|
|
environmental
regulatory innovation |
-- |
||
|
land
under protected status |
% |
||
|
number
of sectoral EIA guidelines |
-- |
||
|
informational
capacity |
availability
of sustainable development information at the national level, environmental
strategies and action plans |
-- |
|
|
%
of ESI variables missing from public global data sets |
% |
||
|
biodiversity |
%
of threatened mammals |
% |
|
|
%
of threatened birds |
% |
Water resources indicators, applicable scales and data requirements
|
Indicator/
Index |
Reference |
Spatial
Scale |
Required
Data |
|
Access
to drinking water |
WHO,
2000 |
country |
percentage
of population with access to drinking water percentage
of population with access to sanitation services |
|
Falkenmark
Water Stress Indicator |
Falkenmark,
1989 |
country |
total
annual renewable water resources population |
|
Dry
season flow by river basin |
WRI,
2000 |
river
basin |
time-series
of surface runoff (monthly data) population |
|
Basic
Human Needs Index |
Gleick,
1996 |
country |
domestic
water use per capita |
|
Indicator
of water scarcity |
OECD,
2001 |
country,
region |
annual
freshwater abstractions total
renewable water resources |
|
Indicator
of water scarcity |
Heap
et al., 1998 |
country,
region |
annual
freshwater abstractions desalinated
water resources internal
renewable water resources external
renewable water resources ratio
of the ERWR that can be used |
|
Water
availability index WAI |
Meigh
et al., 1999 |
region |
time-series
of surface runoff (monthly) time-series
of groundwater resources (monthly) water
demands of domestic, agricultural and industrial sector |
|
Vulnerability
of Water Systems |
Gleick,
1990 |
watershed |
storage
volume (of dams) total
renewable water resources consumptive
use proportion
of hydroelectricity to total electricity groundwater
withdrawals groundwater
resources time-series
of surface runoff |
|
Water
Resources Vulnerability Index (WRVI) |
Raskin,
1997 |
country |
annual
water withdrawals total
renewable water resources GDP
per capita national
reservoir storage volume time-series
of precipitation percentage
of external water resources |
|
Indicator
of Relative Water Scarcity |
Seckler
et al., 1998 |
country |
water
withdrawals in 1990 water
withdrawals in 2025 |
|
Index
of Watershed Indicators (IWI) |
EPA,
2002 |
watershed |
15
condition and vulnerability indicators |
|
Water
Poverty Index (WPI) |
Sullivan,
2002 |
country, region |
internal
renewable water resources external
renewable water resources access
to safe water, access to sanitation irrigated
land, total arable land, total area GDP
per capita under-5
mortality rate UNDP
education index Gini
coefficient domestic
water use per capita GDP
per sector Water
quality variables, use of pesticides Environmental
data (ESI) |
DPSIR Approach

CSD Working List of Indicators of Sustainable Development
In 1996, the United Nations
Commission on Sustainable Development (CSD) developed a working list of
indicators of sustainable development of surface as well as groundwater.
Directly water-related and indirectly water-related indicators are given below.
Directly
water-related indicators of the CSD working list of indicators of sustainable
development
|
Category |
Chapter |
Driving
Forces |
State |
Response |
|
Social |
Protecting
and promoting human health |
|
Percent
of population with adequate excreta disposal facilities |
|
|
|
access
to safe drinking water |
|
||
|
Environmental |
Protection
of the quality and supply of freshwater resources |
Annual
withdrawals of ground and surface water |
Groundwater
reserves |
Waste-water
treatment coverage |
|
Domestic
consumption of water per capita |
Concentration
of faecal coliform in freshwater |
|
||
|
Biochemical
oxygen demand in water bodies |
|
|||
|
Protection
of the oceans, all kinds of seas and coastal areas |
Discharges
of oil into coastal waters |
Algae
index |
|
|
|
Releases
of nitrogen and phosphorus to coastal waters |
|
|
||
|
Promoting
sustainable agriculture and rural development |
Use
of agricultural pesticides |
Area
affected by salinization and waterlogging |
|
|
|
Use
of fertilizers |
|
|
||
|
Irrigation
percent of arable land |
|
|
Indirectly water-related
indicators of the CSD working list of indicators of sustainable development
|
Category |
Chapter |
Driving Forces |
State |
Response |
|
Social |
Protecting and promoting human
health |
|
Life expectancy at birth |
|
|
|
Infant mortality rate |
|
||
|
Environ-mental |
Protection of the quality and
supply of freshwater resources |
|
|
Density of hydrological networks |
|
|
Promoting sustainable agriculture
and rural development |
|
|
Agricultural education |
In 1994, the OECD developed a core
set of environmental indicators, published regularly in OECD environmental
performance reviews. Key indicators, drawn from this set, inform the public
about main subjects of common interest. The indicators are structured in
accordance with the Pressure-State-Response approach. They include indicators
of freshwater quality and of freshwater resources. The indicator that describes
the percentage of a nation’s territory that is protected is indirectly
connected to the water issue as it influences the land use and thus the
pollution and the water quality.
Water-related
indicators of OECD set of key indicators
|
Issue |
Pressure |
State |
Response |
|
Eutrophication |
Emissions
of N and P in water and soil |
BOD/DO
in inland waters |
Population
connected to secondary and /or tertiary sewage treatment plants |
|
N
and P from fertiliser use and livestock |
Concentration
of N and P in inland waters |
User
charges for waste water treatment |
|
|
|
|
Market
share of phosphate-free detergents |
|
|
Toxic
contamination |
Emission
of heavy metals |
Concentrations
of heavy metals and organic compounds in environmental media |
|
|
Emission
of organic compounds |
|
|
|
|
Consumption
of pesticides |
|
|
|
|
Acidification |
|
Exceedance
of critical loads of pH in water |
|
|
Water
resources |
Intensity
of use of water resources (abstractions/ available resources) |
Frequency,
duration and extent of water shortages |
Water
prices and charges for sewage treatment |
|
Biodiversity |
|
|
Protected
areas as % of national territory and by type of ecosystem |
European System of Environmental Pressure Indices (EPI)
The European Commission’s
Environmental Directorate financed an initiative to develop a set of environmental
pressure indicators for the EU in order to describe human activities that have
a negative impact on the environment. 48 indicators were defined structured
according to the DPSIR-approach, including several connected to water (see
table below).
Directly
water-related indicators of the European System of Environmental Pressure
Indices
|
Category |
Indicator |
|
Resource
Depletion |
Water
consumption |
|
Inputs
of phosphate to agricultural land |
|
|
Dispersion
of Toxic Substances |
Index
of heavy metal emissions to water |
|
Emissions
of persistent organic pollutants (POPs) |
|
|
Consumption
of toxic chemicals |
|
|
Water
pollution |
Emissions
of nutrients by households |
|
Emissions
of nutrients by industry |
|
|
Pesticides
used per hectare of utilised agriculture area |
|
|
Nitrogen
quantity used per hectare of utilised agriculture area |
|
|
Emissions
of organic matter from households |
|
|
Emissions
of organic matter from industry |
|
|
Non-treated
urban waste water |
|
|
Urban
Environmental Problems |
Non-treated
urban wastewater |
|
Marine
Environment and Coastal Zones |
Tourism
intensity |
The Mediterranean Commission on
Sustainable Development (MCSD) has the target to provide a tool to measure progress
to sustainable development in the Mediterranean countries. For that reason, a
set of 130 indicators structured according to the PSR-approach was developed by
its activity centre called “Plan Bleu pour l'environnement et le
développement en Méditerranée” (Blue Plan for the
Environment and Development in the Mediterranean), 40 among them were adopted
from the UNCSD working list of indicators
The indicators provide information
in the following categories:
· Population and society
· Lands and areas
· Economic activities and sustainability
· Environment
· The sustainable development: actors and policies
·
Exchanges and co-operation in
the
The included water-related
indicators are summarised in the table below. The indicators that are
indirectly connected to water include several that describe the importance of
tourism in the country and thus the increasing water demand in the holiday
season. Furthermore, two indicators of health that is influenced by the supply
with safe water and two indicators of policies and strategies, representing the
efforts to improve the situation concerning water resources, are shown.
Directly
water-related indicators of Plan Bleu
|
Chapter |
Theme |
Number |
Indicator |
Type1) |
|
Population
and society |
Health,
Public Health |
13 |
Access
to safe drinking water |
R |
|
Economic
activities and sustainability |
Agriculture |
50 |
Use
of agricultural pesticides |
P |
|
51 |
Use
of fertilisers per hectare of agricultural land |
P |
||
|
52 |
Share
of irrigated agricultural land |
P |
||
|
53 |
Agriculture
water demand per irrigated area |
P |
||
|
57 |
Water
use efficiency for irrigation |
R |
||
|
Mines,
Industry |
63 |
Industrial
releases into water |
P |
|
|
Environment |
Freshwater
and waste water |
84 |
Exploitation
index of renewable resources |
P |
|
85 |
Non-sustainable
water production index |
P |
||
|
86 |
Share
of distributed water not conform to quality standards |
S |
||
|
87 |
Water
global quality index |
S |
||
|
88 |
Share
of collected and treated wastewater by the public sewerage system |
R |
||
|
89 |
Existence
of economic tools to recover the water cost in various sector |
R |
||
|
90 |
Drinking
water use efficiency |
R |
||
|
91 |
Share
of industrial wastewater treated on site |
R |
1) P = Pressure indicator, S =
State indicator, R = Response indicator
Indirectly water-related
indicators of Plan Bleu
|
Chapter |
Theme |
Number |
Indicator |
Type1) |
|
Population and society |
Health, Public Health |
11 |
Life expectancy at birth |
S |
|
12 |
Infant mortality rate |
S |
||
|
Lands and areas |
Littoral and “littoralisation” |
28 |
Number of tourists per km of
coastline |
P |
|
Economic activities and
sustainability |
Tourism |
76 |
Number of nights per 100
inhabitants |
P |
|
77 |
Number of secondary homes over
total number of residences |
P |
||
|
78 |
Number of bed-places per 100
inhabitants |
P |
||
|
79 |
Public expenditure on tourism
development |
P |
||
|
80 |
Number of international tourists
per 100 inhabitants |
P |
||
|
81 |
Share of tourism receipts in the
exportations |
S |
||
|
82 |
Currency balance due to tourism
activities |
S |
||
|
83 |
Public expenditure on tourism
sites conservation |
R |
||
|
The sustainable development:
actors and policies |
Policies and strategies of the
sustainable development |
125 |
Public expenditure on
environmental protection as a percentage of GDP |
R |
|
126 |
Existence of environment
national plans and/ or sustainable development strategies |
R |
The Water Framework Directive
established a framework for the protection of inland surface waters,
transitional waters, coastal waters and groundwater. The WFD classification
methodology approaches water resources from an environmental perspective, and
determines different levels of classification of water bodies, from the
microlevel determination of chemical and biological indicators, to the
determination of the quality status of entire bodies, to establishing
macroscale ecoregions.
This Directive, under Article 8
which establishes “Monitoring of surface water status, groundwater status and
protected areas” proposes a comprehensive set of indicators for assessing the
quality of waters, as well as a series of standards and measures for the
protection and improvement of the quality of waters. These measures, a brief
description of which follows, are described in Annex V of the directive. The
status of water bodies is determined, based on these indicators, to be improved
or maintained accordingly.
Regarding Groundwater, the
quantitative and chemical status of the resource is monitored. The parameter
for the classification of quantitative status is the groundwater level regime.
The core parameters for the determination of groundwater chemical status are:
· oxygen content,
· pH value,
· conductivity,
· nitrate,
· ammonium.
The quality elements for the
classification of ecological status of Rivers, Lakes, Transitional waters,
Coastal waters, and Artificial and heavily modified surface water bodies
involve monitoring of:
· parameters indicative of biological quality elements
· parameters indicative of hydromorphological quality elements
· parameters indicative of all general physico-chemical quality elements
· Thermal conditions
· Oxygenation conditions
· Salinity
· Acidification status
· Nutrient conditions
· Transparency, and
· Tidal regime for the transitional and coastal waters
· priority list pollutants, and
· other pollutants discharged in significant quantities.
Article 6 of the WFD establishes a
“Register of protected areas”, which according to Annex IV of the directive
include:
·
areas designated for the
abstraction of water intended for human consumption,
·
areas designated for the protection
of economically significant aquatic species,
·
bodies of water designated as
recreational waters, including areas designated as bathing waters,
·
nutrient-sensitive areas, including
areas designated as vulnerable zones,
·
areas designated for the protection
of habitats or species where the maintenance or improvement of the status of
water is an important factor in their protection, including relevant Natura
2000 sites.

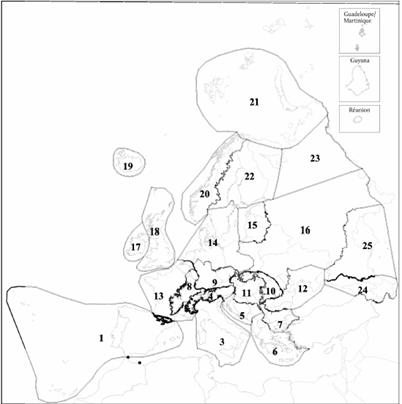
The WFD Ecoregions for rivers and
lakes
Finally, in Annex XI the WFD also
presents a set of ecoregions in the European Union, for rivers and lakes, and
for transitional and coastal waters.

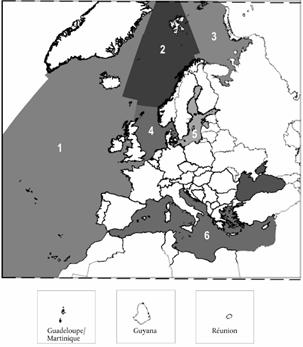
WFD Ecoregions for transitional
waters and coastal waters
As the general idea of the decision
support system (DSS) that has been developed is to compare the performance of
different water management strategies over a sufficiently long period of time,
the evaluation approach that is implemented in the Decision Support System
(DSS) of the WaterStrategyMan is based on a two step procedure.
The first step involves a temporal
aggregation of time series of aggregation into single values, the second step
is aimed at providing time series of indicators as additional information to
the decision maker.
Temporally aggregated values
Based on the primary objectives of
a water management strategy (environmental compatibility, cost recovery of
water services and coverage of demand for all sectors), a set of indicators is
used that “measures” the performance of a strategy compared to those
objectives.
The selected indicators are:
|
|
Indicator |
|
Environment |
Dependence
on Inter-basin water transfer |
|
Desalination
and reuse percentage |
|
|
Groundwater
exploitation index |
|
|
Non-sustainable
water production index |
|
|
Efficiency |
Demand
coverage-Animal breeding |
|
Demand
coverage-Domestic demand |
|
|
Demand
coverage-Environmental demand |
|
|
Demand
coverage-Hydropower demand |
|
|
Demand
coverage-Industrial demand |
|
|
Demand
coverage-Irrigation demand |
|
|
Economics |
Rate
of cost recovery |
A temporal aggregation is done
according to a system performance approach suggested by the American Society of
Civil Engineers (ASCE) that is aimed at temporally aggregated time series of
performance indicators of a system (see Figure below).

For each of the indicators used in
the WSM-DSS, the following values are computed:
· Average value
· Reliability
· Reliability is the probability that a criterion value will be with the predefined range of satisfactory values.
· Resilience
· Resilience is an indicator for the speed of recovery of an unsatisfactory condition.
· It is defined the number of times a satisfactory value follows an unsatisfactory value related to the total number of values.
· Max. Extent
· Duration
For the evaluation of a given
strategy, an overall score is computed using the temporally aggregated
criterion values. Weights can be assigned to indicator values to reflect the
preference structure of the decision-maker. The aggregation of all indicators
mentioned above results in a score for any given strategy so that a ranking of
those strategies can directly be obtained.
Time series of indicators
In addition to the indicators and
indices that are directly used for the evaluation of water management
strategies, the DSS provide a number of additional time series of indicators
and indices based on the primary data that is either modelled by the system or
entered as initial data.
Their purpose is merely to provide
the user with additional information on the evaluation process.
Additional time series of
indicators in the WSM-DSS
|
|
|
Indicator |
|
Environment |
Exploitation |
Total
Water production |
|
Groundwater
exploitation index |
||
|
consumption
index |
||
|
Non-sustainable
gw production |
||
|
Dependencies |
Dependency
ratio |
|
|
Anthropogenic
water produced/total water production |
||
|
Water
quality |
Percentage
of treated urban water |
|
|
Share
of primary treatment |
||
|
Share
of secondary treatment |
||
|
Share
of tertiary treatment |
||
|
Social
Indicators |
Pressures |
Agricultural
demand per ha |
|
Tourist
per inhabitant |
||
|
Water
abstractions per capita |
||
|
Deficits |
Domestic
deficit as percentage of demand |
|
|
Industrial
deficit as percentage of demand |
||
|
Environmental
deficit as percentage of demand |
||
|
Hydropower
deficit as percentage of demand |
||
|
Irrigation
deficit as percentage of demand |
||
|
Economics |
|
Direct
costs |
|
|
Environmental
costs |
|
|
|
Revenues |
|
|
|
Rate
of cost recovery |
· WaterStrategyMan Website, http://environ.chemeng.ntua.gr/wsm/
· Agenda 21, http://www.un.org/esa/sustdev/documents/agenda21/index.htm
· The Water Poverty Index: International comparisons, 2002, http://www.nerc-wallingford.ac.uk/research/WPI/images/wdpaper.pdf
· OECD (Organisation for Economic Co-operation and Development), Environmental Indicators Towards Sustainable Development, http://www.oecd.org/dataoecd/7/47/24993546.pdf
· World Economic Forum, 2002 Environmental Sustainability Index, An initiative of the Global Leaders of Tomorrow Environment Task Force, http://www.ciesin.columbia.edu/indicators/ESI
·
EPA (
· Le Plan Bleu, Environnement et développement en Méditerranée: http://www.planbleu.org