Portugal
Range of
Circumstances and
Region Analysis
Introduction
The
average annual temperature in the SEC oscillates between 10 and 17ºC and
is higher than that in the other countries of

Figure 1. Average annual precipitation in
SEC (mm/year)
It
is worth noting not only the great spatial variations in the precipitation in
the Iberian Peninsula (with minima somewhere in the region of 350 mm/year in
the driest zones in Portugal and 200 mm/year in Southeast Spain) as also
temporal irregularity in terms of its precipitation distribution, with some
regions where maximum rainfall in a single day is sometimes not far short of
the whole of the precipitation for the year.
The
average effective evapotranspiration in any of the
SEC (Southern European Countries) is around 450 to 500 mm, with a maximum of
500 mm in
Due
to that inequality in water distribution, both in space and time, and to the
high evapotranspiration rate, some areas of Portugal
such as Sado and Guadiana
basins as also Algarve Coastal River Basins are not only currently facing some
short-term water shortage problems as well as some long-term ones are also
foreseen.
Aiming
to analyse those problems framed into a national water resources reality, this
report is divided in three sections, correspondent to different subjects: the
first section gives an overview of the country water resources, water demands,
as also the analysis of the water's institutional framework, the second part
aims to characterize the three candidate regions, and, the third part is an
overview of the range of circumstances in all 15 River Basins of Portugal
Continental territory. In fact, Portuguese territory includes also, in addition
to mainland territory, two groups of islands (Azores and Madeira), but on those
islands the water resources characterization is still being carried up by means
of Regional Water Plans, and water scarcity problems are only foreseen, at this
moment, for Porto Santo island (where desalination is employed), in Madeira’s
group of islands. We shall then concentrate on mainland territory. Figure 2
presents a map of the correspondent river network and Table 1 a summary of its
physical characteristics.
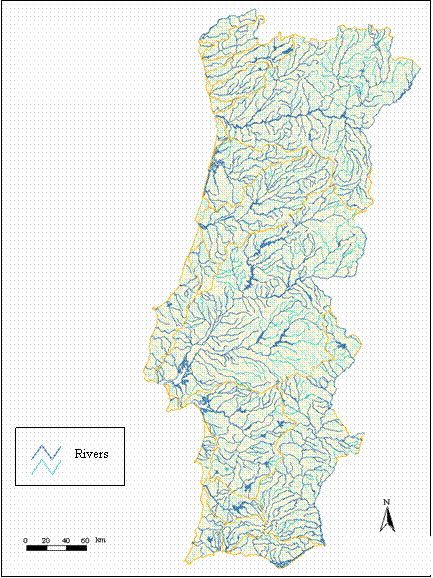
Figure
2: Surface waters in mainland
Portugal
Table
1: Summary of mainland Portugal’s physical characteristics
|
Background |
Description |
|
Climate |
The climate
in Portugal Continental territory ( The
averaged yearly precipitation in Portugal Continental territory is of about
960 mm, varying from more than 2,000 mm in the northern region to less than
600 mm in |
|
Geomorphology |
Mainland Portugal also has
an extended coastline. |
|
Geology |
On most of the
country, soil formations are mainly composed by metamorphic, igneous and
volcanic rocks. Some regions (as Tejo and Sado basins and some coastal areas)
present tertiary and quaternary deposits with formations mainly composed by
limestone and sedimentary rocks. |
|
Ground Water |
Most of the
country has aquifers of low productivity (on average, 50 m3/day/km2). Higher productivity aquifers occur: in
Tejo and Sado basins, with maximum’s of 500 m3/day/km2;
in the centre coastal areas, with 400 m3/day/km2; in
some spots of |
|
Surface Water |
The total availability in terms of surface
water in Portugal Continental territory in an average year (guarantee of 50%)
is about 47000 hm3. The international rivers are of great importance
as they are the bigger river basins of |
|
Water storage features |
The total
water storage capacity in mainland |
Overview of the
country
Water Demand and Supply Status
In
the last years, due to the National Water Plan and to the River Basins Plans
elaboration studies,
v
Concerning to water resources
characterisation, in quantitative terms, two situations may be
distinguished: the surface water case,
of which, due to a good quantitative monitoring network, availability of water
is nowadays well defined; and the ground water case, of which the information
is not so easy to obtain because of the lack of development of the
correspondent network. This last is similar to the situation on water quality
characterisation, where information is still lacking due to more complex and
expensive procedures.
v
Concerning to water demand and
supply, due to the lack of reliable direct information, the data was estimated
by using indirect methods to determine the needs and consumption of the various
sectors. These indirect methods considered occupied area, number of workers,
raw material and products in the case of industry; irrigation areas, crops
types, irrigation systems and efficiency in agriculture water use.
In
terms of water supply the percentage of population served is currently of 85%
in Continental Portugal, this percentage decreasing to 64% referring to
wastewater drainage connections, but only 42% benefiting from treatment
facilities. However, the National Water Plan (PNA) prospects as some of the
main national short-term water priorities that, by 2006, 95% of the total population
should be connected to water supply (having drinking water at home) and 90%
served with sewerage and wastewater treatment.
The
demands and needs in mainland
Table
2: Monthly average precipitation and potential evapotranspiration
in Continental Portugal
|
Description |
Out |
Nov |
Dec |
Jan |
Feb |
Mar |
Apr |
May |
June |
July |
Aug |
Sept |
|
Precipitation (mm) |
94 |
121 |
136 |
129 |
122 |
108 |
79 |
67 |
37 |
11 |
13 |
44 |
|
Potential Evapotranspiration (mm) |
72 |
40 |
29 |
30 |
40 |
69 |
94 |
126 |
151 |
177 |
162 |
112 |
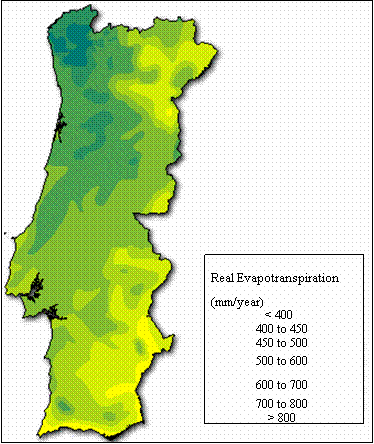
Figure 3: Real Evapotranspiration in
Continental
The
high agriculture water consumption (about 74% of the total water uses, one of
the highest in European Union countries, and still foreseen to increase in the
near future) is in fact one of the causes of water shortage problems, competing
with other sectors, namely the water supply sector. Aggravating this situation
is the low overall efficiency in agriculture water use (less than 60% North of Tejo, about 60% South of Tejo).
The increase of these efficiency values is also a short-term water priority,
according to the PNA.
Tourism
is concentrated on coastal areas (mainly the southern
There
is an intense use of groundwater resources, especially on agriculture (about
65% of this sector water consumptions), which may lead to an over-exploitation
of the aquifers, with effects on water quality on coastal areas due to saline
intrusion. Urban water supply overall losses are another problem as they are
currently very high, about 33%. The decrease of these values is another of the
short-term water priorities prospected by the National Water Plan.
Almost
40% of the current surface water resources in mainland Portugal come from
Spain, which account for the importance of water quality in the international
river basins, of inter basin water transfers and of agriculture water
consumption downstream effects.
Tables
3 and 4 present, respectively, the available resources (surface water and groundwater) and the water
consumption for each sector, per river basin, in Portugal Continental
territory.
Table
3: Available Resources
|
River Basin |
Stable Water Resources (hm3) |
||
|
Surface Water * |
Exploitable Groundwater |
Total |
|
|
Minho |
8465 |
80 |
8545 |
|
Lima |
3065 |
149 |
3214 |
|
Cávado |
2099 |
161 |
2260 |
|
Ave |
1048 |
139 |
1187 |
|
Leça |
94 |
22 |
116 |
|
Douro |
17841 |
773 |
18614 |
|
Vouga |
1732 |
404 |
2136 |
|
Mondego |
3430 |
578 |
4008 |
|
Lis |
225 |
224 |
449 |
|
Ribeiras
do Oeste |
267 |
208 |
475 |
|
Tejo |
14021 |
2667 |
16688 |
|
Sado |
918 |
796 |
1714 |
|
Mira |
291 |
53 |
344 |
|
Guadiana |
3156 |
429 |
3585 |
|
Ribeiras
do Algarve |
327 |
272 |
599 |
|
Mainland |
56979 |
6956 |
63935 |
* Regularized flow (including affluences from
Table 4: Water consumption
|
River Basin |
Water Consumption (hm3) |
|||||||||||||
|
Supply |
Tourism |
Irrigation |
Industry |
Energy Production |
Total
|
|||||||||
|
Surface Water |
Ground Water |
Total |
Surface Water |
Ground Water |
Total |
Surface Water |
Ground Water |
Total |
Surface Water |
Ground Water |
Total |
|||
|
Minho |
0.93 |
2.95 |
3.88 |
0.005 |
0.015 |
0.02 |
30 |
50 |
80 |
0.038 |
0.086 |
0.124 |
- |
84.024 |
|
Lima |
2.50 |
4.64 |
7.14 |
0.042 |
0.078 |
0.12 |
60 |
100 |
160 |
9.227 |
1.050 |
10.277 |
- |
177.537 |
|
Cávado |
10.38 |
2.60 |
12.98 |
0.144 |
0.036 |
0.18 |
75 |
160 |
235 |
1.702 |
1.024 |
2.726 |
- |
250.886 |
|
Ave |
15.47 |
4.62 |
20.10 |
0.123 |
0.037 |
0.16 |
65 |
210 |
275 |
3.370 |
4.588 |
7.958 |
- |
303.218 |
|
Leça |
25.56 |
0 |
25.56 |
0.220 |
0.000 |
0.22 |
5 |
25 |
30 |
10.738 |
5.340 |
16.078 |
- |
71.858 |
|
Douro |
63.71 |
23.56 |
87.27 |
0.526 |
0.194 |
0.72 |
405 |
940 |
1345 |
8.067 |
26.360 |
34.427 |
87.63 |
1555.047 |
|
Vouga |
10.92 |
21.20 |
32.13 |
0.061 |
0.119 |
0.18 |
75 |
280 |
355 |
24.314 |
4.070 |
28.384 |
- |
415.694 |
|
Mondego |
19.39 |
16.51 |
35.90 |
0.151 |
0.129 |
0.28 |
160 |
465 |
625 |
66.139 |
4.900 |
71.039 |
- |
732.219 |
|
Lis |
1.35 |
7.63 |
8.97 |
0.012 |
0.068 |
0.08 |
20 |
30 |
50 |
0.051 |
0.359 |
0.41 |
- |
59.460 |
|
Ribeiras
do Oeste |
39.53 |
13.89 |
53.42 |
1.325 |
0.465 |
1.79 |
45 |
110 |
155 |
0.875 |
2.966 |
3.841 |
- |
214.051 |
|
Tejo |
139.08 |
81.68 |
220.75 |
1.777 |
1.043 |
2.82 |
710 |
1280 |
1990 |
45.402 |
101.163 |
146.565 |
476.98 |
2837.115 |
|
Sado |
5.84 |
18.49 |
24.33 |
0.134 |
0.426 |
0.56 |
295 |
145 |
440 |
33.827 |
23.989 |
57.816 |
672.35 |
1195.056 |
|
Mira |
0 |
0.88 |
0.88 |
0.000 |
0.010 |
0.01 |
75 |
20 |
95 |
0.030 |
0.036 |
0.066 |
- |
95.956 |
|
Guadiana |
8.69 |
5.33 |
14.02 |
1,023 |
0,627 |
1,65 |
225 |
175 |
400 |
2.335 |
0.928 |
3.263 |
- |
418.653 |
|
Ribeiras
do Algarve |
11.14 |
10.70 |
21.84 |
5,019 |
4,821 |
9,84 |
80 |
225 |
305 |
0.302 |
2.054 |
2.356 |
- |
340.136 |
|
Mainland |
354.49 |
214.68 |
569.17 |
10.561 |
8.069 |
18.63 |
2325 |
4215 |
6540 |
206.417 |
178.913 |
385.332 |
1236.96(1) |
8750.090 |
Environment and protection
Several
conflicts arise due to the quality of water for the several uses. There is a
weak treatment capacity of the polluted charges, namely the ones produced by
urban and industrial water supply. The pressure is higher in the coastal areas,
where population is concentrated, thus the quality of surface waters on those
areas is not, currently, for most of the rivers, as good as of upstream
stretches, except on some bordering areas. On figure 4 it can be seen the loads
affluent to the hydric environment in Portugal
Continental territory. Urban wastewaters are responsible for more than 57% of
these pollutant loads.

Figure 4: Loads affluent to the hydric medium
in Portugal Continental territory
Major
water quality problems occur on the shared rivers bordering stretches, where
the quality of surface waters is inadequate, according to legislation,
similarly to some downstream stretches and to almost all coastal areas, with
values of pollutant loads exceeding the recommended for human consumption.
Another problem is that mainly in the south of
Due
to the insufficient monitoring network the only data available in terms of
quality of groundwater relates to the water consumption’s most important
aquifers. Although nitrates pollution
can occur in superficial water and in groundwater, the higher values occur in
the last one, as a consequence of the intensive use of fertilisers in
agriculture. Figure 5 shows the most important aquifers in mainland
Concerning
to shortages of water it shall be referred that drought situations occur in
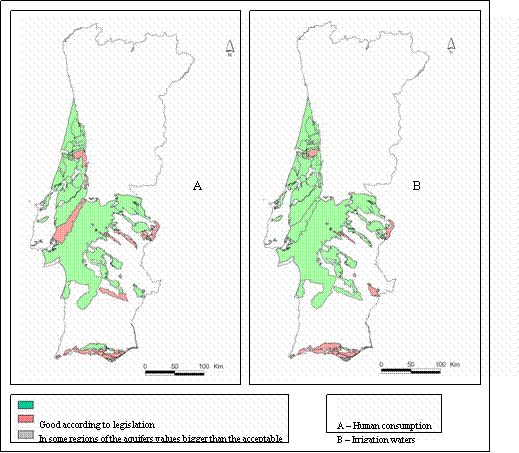
Figure 5: Quality in ground waters for different sector uses
Water laws and regulations
Portuguese
water laws and regulations are framed under the respect of International Law,
bilateral Portuguese-Spanish shared river agreements and of European Union
Water policy and Directives, to which evolution and inter-relation (in some
cases still) has to be adapted.
The
main aim of the Portuguese-Spanish still active bilateral international rivers
Conventions (dating to 1964 and 1968) was to rule the share of water and
hydroelectric potential production of bordering river stretches. The 1998
“Convention on Cooperation for Portuguese-Spanish River Basins Protection and
Sustainable Use” envisages to co-ordinate efforts on shared river basins
management, aiming to attain improved risk prevention and ecosystem protection
on those basins, respecting modern principles of international law. That
Convention is clearly framed (Maia, 1999) by the UN
1991 Espoo Convention, the UN 1992 Helsinki
Convention – both of them ratified by
the EU and, therefore, with principles that any EU member can apply to -, and not only by (the time)
active EU Directives but also by the principles of the 2000 approved Water
Framework Directive. Furthermore, and although not yet active, the UN 1997
approved “Convention on the Law of the Non-Navigational Uses of International
Watercourses” can also be considered a reference Law.
The
Portuguese legislation (still) excludes from the hydro public domain
groundwater and surface private water, relating to principles dating back to
1919 (Water Law) and 1966 (Civil Code). The juridical regime on the utilisation
of the hydro domain was revised and reviewed in 1994, together with a new
institutional framework definition. Since then Portuguese water management
model is founded on shared responsibilities between a National Water Institute
(INAG) and the Regional Environmental and Territorial Planning Administrations
(DRAOT’s[1]), both firstly
under the Ministry for Environment and Natural Resources, which later turned
into Ministry of Environment and of Land-Use Planning (MAOT) - and in the 2nd semester of
2002 into Ministry of the Cities, Environment and Land-Use Planning (MCOTA).
That was due to a set of diplomas:
v
Decree-law nº 45/94 of
v
Decree-law nº 46/94 of
v
Decree-law nº 47/94 of
These
legislation principles and institutional organisation entail on the 1997
Environmental Basis Law principles (Law 11/87, EBL), by which (i) it was already stated that a national co-ordination of
environmental and land-use territory policies should occur (which in fact came
to occur formally in 1999, with the creation of MAOT) and the river basin was
stated as the water resources management unit.
More
broadly, the national Portuguese legal framework may be described as based on
three different areas: juridical instruments for water protection, juridical
framework for administrative procedures and administrative institutions. The
two last will be described further when referring to institutional organisation
and constraints. Concerning to the juridical water protection main regulations
one may distinguish:
1. Direct ruling
v
Water Quality Norms: (i) General: DL 236/98 and (ii) Special (e.g., dangerous
substances discharges, for activity sectors, etc.)
v
Water Quality Zones, p.e., by Protected Areas Definition and River Basin Plans
(RBP) definition.
v
Water Resources licensing, as
referred reporting to DL 46/94, based on a methodology of licence of the use
and not of the economic activity, but these obliged to environmental impact
assessment (DL 69/2000 or DL 194/2000)
2. Indirect ruling
v
Financial and fiscal
instruments, as referred reporting to DL 47/94, but very ineffective
v
Planning instruments: (i) National Environment Policy Planning and the
Conservation of Nature National Strategy (defined by EBL), (ii) RBP and
National Water Plan definitions (as defined by DL 45/94) and (iii) Special
Planning Instruments (p.e., DL 236/98, on: action for
reduction of pollution of internal fishing water and of coastal waters; on
quality improvement on bathing waters; on plans for water irrigation; and, on
reduction of dangerous substances).
Concerning
to water supply and drainage systems, the Portuguese system was long developed
based on regional administrative boards, i. e.,
municipality boards, usually via municipal water companies with management
directly controlled and ruled by the municipality. Following a change on the
legal framework in 1993, by which not only multi-municipal systems were
promoted (and five created by Dec-Law 379/93) as also private capital access to
economic water supply and drainage activities was open (Dec-Law 379/93), and
after definition in 1994 (Dec-Law 319/94) of the concession regime basis for
those systems, several municipal and pluri-municipal
were created and/or explored on a concession basis – the last mostly by public
owned companies ruled under private law rules and the former (operating on that
basis) more open to private capital and
management. In 1998 (Dec-Law 58/98) the municipalities were allowed also
to create autonomous (and with their own capital) urban water/drainage
companies.
Institutional Framework and constraints
As
previously referred, the current institutional water management model is
founded on the sharing of the management of domestic water resources between
two institutions under the Ministry of the Cities, Land-Use Planning and
Environment (MCOTA, former MAOT, Ministry of Land-Use Planning and Environment)
- INAG (national) and the DRAOT’s[2] (regional). These
last correspond to rename (when MAOT was created, in 1999) the former Regional
Environmental and Natural Resource Administrations (DRARN’s)
created in 1993, with district boundaries defined in accordance with the remits
of the administrative Local Coordination Commissions (CCR’s)
and with no correspondence with the river basin areas (figure 6). Five DRAOT’s do exist (Northern, Central,
Table
5 shows the hierarchical institutional responsibility distribution not only
between the referred and other MCOTA Administrations but also for other
relevant water policy Administrations dependent of other Ministries.
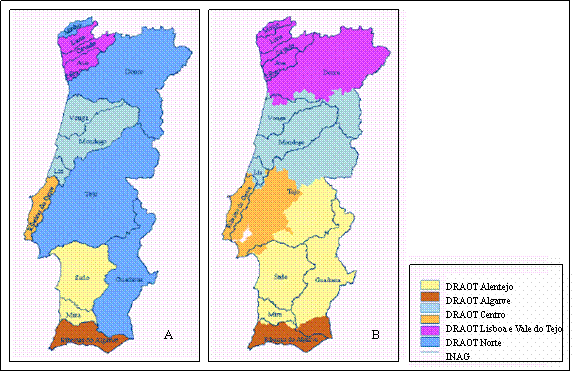
Figure 6. Maps of
River Basins (A) and DRAOT’s (B)
It
becomes visible that although the relevant role of INAG, it is not possible, in
a legal sense, to name a true water authority in Portugal - and that is reflected on the
water legislation framework and application (Aires, 2001):
v
Decree-law nº 45/94 - by which not only the now
MCOTA Table 5’s referred institutions as also the National Water Council and
the River Basin Councils were created with defined responsibilities - made INAG responsible by
drafting the River Basin Plans (PBH’s) for the
International Rivers as well as the National Water Plan (PNA) and defined as
the 5 Regional Boards task drafting the River Basin Plans for the national
rivers, according to their area of jurisdiction. Drafting of the PBH’s did start only late 1997 and was completed October
2000 (for the international basins) and February 2001 (for the national
basins). The National Water Plan was
completed in August 2001.
v
Decree-law nº 46/94 ruled
the licensing regime for water use but in fact effective licensing did not
effectively occur, which may be regarded as one of the major flaws of the
current water resource management system in that the Regional Boards, have
failed to secure the registration, cadastral survey and licensing of all water
occupations and uses. This led to gaps in basic information which namely had
consequences and constrained PBH’s drafting and that
will have repercussions in the implementation of Directive IPPC on integrated
pollution prevention and control.
v
Decree-law nº 47/94 ruled
the economic and financial regime on public water, aiming to ease the financial
burden on the water management institutions, but was mismanaged in its
application due to the wrong (political) implementation timing and also because
it was intended to encompass all users instead of focusing on the more
important and significant uses.
Table 5. Responsible Authorities in the Water Sector
Agency /Authority
|
Responsibilities
|
|
Ministry
of Cities, of Land-use Planning and Environment (MCOTA) |
To define, co-ordinate and execute
environmental policy and territory ruling,
namely: a) To manage on a global and integrated form
national water resources in order to achieve a temporal balance between water
availability and demand and to control pollution, safeguarding hydric environment. b) To guarantee integrated and sustained
coastal management, namely based on different institutions, as INAG, DRAOT,
DGA and ICN. |
|
INAG |
Responsible by the prosecution of national
policies on water resources and water supply and drainage, namely. -
To develop information systems on national water availability and
needs -
To promote an integrated planning on a river basin basis as also of
the littoral -
To promote conservation of national water resources on quantity and
quality, etc. |
|
DRAOT (now CCDR ) |
Promote and execute at regional level the
environmental and territory ruling policy |
|
DGA |
Co-ordination, study, planning and inspection
of environment and natural resources sectors |
|
ICN |
Nature Conservation, national coordination |
|
Ministry
of Agriculture, of Rural Development and Fishing (MADRP) |
Some of its attributions interfere with water
resources |
|
IDHRa |
To develop information systems on water needs
and current utilisation of water resources in agriculture To support water resources conservation and
use and hydro-infrastructure development on agriculture |
|
DGF |
To co-ordinate and support the execution of
the policy on fishing river basin internal resources |
|
Ministry
of Economy (ME) |
Responsible by national energy industry
development |
|
DGE |
Responsible by the conception, execution and
assessment of national energy sector policy, aiming to use national
resources. |
|
Ministry
of Health (MS) |
Competencies on public health with
implications on water resources |
Coastal
management duties are currently assigned to INAG (although its organic law does
not contemplate any Services Directorate or even a Division exclusively
dedicated to coastline issues), with all the mainland coastline being into its
jurisdiction, except for the port areas (under the jurisdiction of Port Local
Boards) and the areas of special interest for nature protection and
conservation, which were assigned to the Nature Conservation Institute (ICN).
The Coastline Planning Schemes (POOC’s) drawn up by
INAG and ICN have seen their integration goal hindered and truncated because
the port zones were excluded, as they did not come under the same Ministry.
Also all the estuaries are under the jurisdiction of port entities that manage
vast areas, aiming to account for large expansion plans and the need for
maintenance of navigation channels. The Water Framework Directive, with its
integrating approach and vision, now entails that both the transition and
coastal waters are managed in conjunction with the whole of the river basin
area, which will force an adjustment to the present institutional model.
Concerning
to water supply and residual water, and following a 1993 legislation framework
change, as already referred, there was a relevant last decade development of
private and (mainly) public water industry, based on a concession contract. The
scope of the concession on water supply and drainage systems is to substitute
municipal responsibilities in what concerns abstraction, treatment and
distribution of urban water and to collect and treat water effluents, and this
may imply construction, repair and maintenance of the systems. Currently,
(mostly primary) water supply for 70% of the population and also of 60% for
(main) wastewater drainage and treatment systems is of responsibility of
“Águas de Portugal Group”, an holding company (with major public
capital, under private right statutory rules) ruling , by mid 2002, over 12
companies with concession on multi-municipal main water supply/drainage systems
and 7 companies (plus 3 with no major participation) with concession on
municipal secondary (domestic) water supply/drainage systems – this adding to
its’ 14 companies (of which 13 with major participation) with concession on
municipal urban solid waste. The full private concession systems are still only
a few and mostly operating on municipal concession of urban water
supply/wastewater drainage and treatment secondary (domestic) network systems,
whereas the majority of these systems is currently managed and operated directly
by municipalities and/or municipal companies. A specific regulator institution
(IRAR) was created in 1998 (DL 326/98), with the purpose of ruling over
multi-municipal and municipal concession explored urban water supply, residual
water and solid waste systems, in order to protect and safeguard citizen
interests and rights.
Concerning
to Public Consultative Bodies on water issues, one shall emphasise:
v
The National Water Council
(CNA), created by Article 9 of Decree-Law nº 45/94 of 22 February 1994 and
presided over by the Minister for the Environment and Land-Use Planning, is a
national planning advisory body on which the Public Administration as well as
the most representative professional and economic bodies concerned with the
various uses of water are represented, and is aimed to deliver expert opinions
to support decision-making, as well as to inform the relevant Plans (as in the
case of the PBH’s for international rivers). It is
also its task to oversee the drafting of the National Water Plan and inform the
proposal thereof before its approval.
v
The River Councils (RC),
created by Article 11 of Decree-law nº 45/94 of 22 February 1994, on which
are represented both the Public Administration and the users, are entrusted
with overseeing the drafting of the River Basin Plans and with informing such
plans, as well as rule on, and promote, actions in respect of a number of
issues relating to water resource management within each river basin.
Apart
from the participation of elements representing agricultural irrigation
associations and sector of activity’s end users on RC’s, in addition to NGO’s
(on both CNA and RC), the populations do not have real formal participation on
water resources issues.
As
referred before, Table 5 shows also some Ministry’s (other than MCOTA) involved
on water (or related) policy issues. Some of that involvement is also related
(or responsible) by constraints facing the water sector, enhancing natural,
human technical and financial constraints (Table 6).
Table 6. Constraints facing Portuguese water resources
|
Category |
Constraints |
|
Natural
|
Uneven
spatial and temporal water resources distribution Large
dependence on transboundary water |
|
Human |
Uneven
population distribution (located mainly on coastal areas) Tourism
pressure on coastal areas Agricultural
water use largely dominant Demand
peaks on the dry season Lack
of environmental awareness |
|
Technical
|
Old
agriculture infrastructure Lack
of proper irrigation techniques Large
water supply network losses |
|
Juridical
|
Lack
of enforcement of water and environmental laws (which, very often, are
ineffective) Juridical
system deficiencies (no clear “rules of game”; overlapped and no co-ordinated
institutional responsibilities) No
clear basis on water quality rules definition No
legal framework for multi-purpose hydraulic plants No
actual national Water Law |
|
Financial |
Non-effective
economic and financial regime (leading to poor financial resources for water
authorities) Pricing
of water is (namely in agriculture) distorted and largely subsidised Insufficient
data for costs characterisation |
|
Administrative
and institutional |
Management
of water resources not made on a River Basin basis No
real National Water Authority Need
to articulate different water management entities (e.g., for multi-purpose
hydraulic plants) Incipient
participation of Civil Society Insufficient
law monitoring and enforcement Insufficient
administrative human resources |
Management, institutional and policy options
As
already referred, the Portuguese water administrative regions do not actually
coincide with the river basins, although water resources’ planning is made (by
law, since 1994) on a river basin basis.
Nevertheless, that is due to change shortly under the current
re-structure of the Portuguese institutional framework system. Meanwhile, a
National Water Plan and the 15 Continental River Basin Plans were approved in
2001, already taking into account Water Framework Directive compliance needs.
In order to that, Portugal shall create River Basin Districts and
Administrations and that is already foreseen by the “Lei da
Água” (National Water Law) proposal presented
last 22 of March, taking into account Spanish reality for the case of the
shared river basins. In fact not only the adequacy and compliance with European
Union Water policy are pushing to internal development of the country own water
reform policy and institutions, but also that shall respect and profit from a
bilateral (with Spain) co-operation tradition and agreements, namely the
“Convention on Co-operation for Protection and Sustainable Use of
Portuguese-Spanish River Basins”, active since January 2000.
The
Portuguese National Water Plan (approved by the end of 2001), other than
deciding eventual inter-basin water transfers and co-ordinate planning actions
with
Table
7. PNA’s Legal and Institutional Framework action
axis
|
Program |
Measures
|
Main
Interventions |
Types[3] |
|
Implementation of the
New Portuguese-Spanish Convention |
Portuguese-Spanish
shared river basins |
-
Definition of bilateral joint measures -
Definition of environmental flows -
Definition of estuaries management measures -
Water monitoring of international river stretches |
P; External Relations P; External Relations P;
P&P; External Relations P&P;
External Relations |
|
Legal and
Institutional Framework adequacy |
Legal Framework
adequacy |
-
Elaboration of the “Water Law” -
Compilation of Water legislation -
Establishment of a coastal waters’ legal framework -
Implementation of a integrated system for cadastral and licensed use |
L&I L&I L&I L&I;
P&P |
|
|
Administrative
Reinforcement |
-
Adequate Administration to the implementation of RBP -
Promote and educate human resources on water resources management |
L&I; P; E&F P&P |
|
|
Identify and create
River Basin Districts and Administrations |
|
P; L&I; E&F |
Table 8. PNA’s Environmental Sustainability action axis
|
Program |
Measures
|
Main
Interventions |
Types
(See
Table 7) |
|
Protection,
Rehabilitation and Promotion of water resources quality |
Control of quality of
all types of water |
- Classification and
control of surface water/groundwater, according to different uses - Elaboration of Plans
of action to achieve aimed quality - Establishment of
discharge rules function of receiving water quality goals |
P&P P P; L&I |
|
|
Assessment and control
pollution sources |
- Elaboration of Plans
of action to improve quality of water on sensible or degraded water or
riparian areas - Delimitation of
protection areas to surface/groundwater abstractions due to dangerous
substances - Assessment and
control of discharges of polluting discharges - Promote application
of Good Agriculture Code Practise |
L&I P&P P&P P&P |
|
|
Protection of origins
of water for water consumption |
- Elaboration of an
intervention plan for each drainage basin - Delimitation of
protection areas to surface and groundwater for water consumption |
P P&P |
|
|
Minimization of
drought effects |
- Establishment of a
methodology (i)
to characterise drought periods (ii) to manage water
resources on drought - Elaboration of a
Contingency Plan for drought periods |
P P P&P; L&I |
|
|
Minimization of
pollution accidents |
- Elaboration of
Emergency Plans for accidental pollution cases |
P&P; L&I |
|
Reduction and Control
of Topic Pollution |
Urban and industrial
drainage and treatment wastewater systems |
- Construction or
rehabilitation of small urban centre systems - Promotion and
creation of pluri-municipal systems |
P&P;
E&F P&P; L&I |
|
Environmental and
Biologic Conservation |
Environmental Flows (E. F.) |
- Study of E.F.
regimes - Adequate hydraulic plants to guarantee
permanent E.F. |
P P&P;
E&F |
|
|
Ecosystem conservation
and rehabilitation |
- Assessment of
environmental risks - Management and
recuperation of fluvial ecosystem |
P P;
P&P; E&F |
Table 9. PNA’s
Sustainable Demand Management action axis
|
Program |
Measures
|
Main
Interventions |
Types
(See
Table 7) |
|
Guarantee of water
supply for human use and for activity sectors |
Domestic and
industrial supply |
- Promotion and
creation of pluri-municipal systems - Increase of level of
water supply guarantee, by creation of reserves - Construction and
rehabilitation of infra-structure |
P&P;
E&F P&P;
E&F P&P;
E&F |
|
|
Irrigation |
- Increase of level of
water supply guarantee, by creation of reserves - Construction and
rehabilitation of infra-structure |
P&P;
E&F P&P;
E&F |
|
Conservation of water
resources |
Efficiency on use of
water: domestic and industrial supply |
- Promotion of
efficient use of water - Identification and
reduction of systems’ water losses and of non-accountable consumption |
P&P P&P |
|
|
Efficiency on use of
water for irrigation |
- Identification and
reduction of systems’ water losses and more rational use of water |
P&P |
Table
10. PNA’s
Integrated Management of Water Resources action axis
|
Program |
Measures
|
Main
Interventions |
Types
(See
Table 7) |
|
Valorisation of Hydro
Domain |
Recreation and leisure |
- Elaboration of plans
for fluvial beaches (f. b.) - Creation of f. b. |
P P&P |
|
|
Fluvial navigation |
- Development of
commercial navigation |
P;
P&P; E&F |
|
|
Sediment |
- Elaboration of plans
for river sediment extraction |
P |
|
|
Other uses |
- Wastewater reuse |
P; L&I; P&P |
|
Planning and
Management of Hydro Domain |
Hydro domain Planning |
- Classification of
river network - Hydro domain
delimitation criteria and definition - Main Estuaries and
lagoons integrated management plans |
P P; L&I P; L&I |
|
|
Floods Prevention and
Minimisation |
- Elaboration of flood
zoning maps - Elaboration of
Emergency Flood Contingency Plans - Execution of
Non-structural flood defence measures |
P&P P; L&I P&P |
|
|
Conservation of fluvial
network systems |
- Re-naturalisation of river channels and
banks |
P&P |
Table
11. PNA’s
Economic and Financial Sustainability action axis
|
Program |
Measures
|
Main
Interventions |
Types
(See
Table 7) |
|
Promotion and
Consolidation of Water Market |
|
- Assessment of fiscal
instruments - Definition of
financing models - Analysis of adequacy
of management entities to the water market |
E&F E&F E&F |
|
Economic and financial
regime application |
User-pay principle |
- Implementation of
the principles of user-pay and polluter-pay principles - Revision and
application of E&F regime to public hydro domain - Studies on water
pricing - Establishment of a
water pricing policy - Definition of
E&F regime applicable to (i
) domestic water supply and (ii) irrigation systems |
P&P;
E&F E&F;
L&I E&F P;
E&F L&I |
|
|
Cost of water |
- Assessment of all
costs to be internalised - Assessment of real
costs of the systems - Establishment of
“rough water” price - Studies for fixing
taxes and tariffs |
E&F;
P&P E&F;P&P E&F E&F;
P |
Table
12. PNA’s Citizen Information and Participation
action axis
|
Program |
Measures
|
Main
Interventions |
Types
(See
Table 7) |
|
Divulgation and
Awareness |
|
- Campaign to increase
awareness on water issues - Formation and
information on water resources environmental sustainability |
P&P P&P |
|
Promotion and Users
Participation |
|
- Environmental water
issues education |
P&P |
Table
13. PNA’s Knowledge, Study and Applied Research on
Water Resources action axis
|
Program |
Measures
|
Main
Interventions |
Types
(See
Table 7) |
|
Monitoring and
Information Systems |
Monitoring systems |
- Improve monitoring
of: (i)
surface water (ii) groundwater - Ecological and
biological monitoring network - Sediment transport
monitoring network - Implantation of
climate network - Coordinated coastal
monitoring system |
P&P P; P&P P; P&P P; P&P P; P&P P&P |
|
|
Cadastral, information
systems and GIS |
- Urban water supply
and wastewater infrastructure (i) cadastral system (ii) quality control
system - Creation of a system
to support water resources management - Maintain and explore
an effective water resources information system |
P&P P&P P; P&P P&P |
|
Studies and
Investigation |
|
- Development of
hydrological and hydraulic studies - Development of DSS
on economic water use - Characterization and
assessment of fluvial, estuarine and coastal ecosystems |
P&P P; P&P P; P&P |
|
Assessment of National Water Plan (PNA) and River Basin
Plans (RBP’s) |
|
- Systematic
assessment of the Plans - Control of Plans
application |
P&P P&P |
The
National Water Plan prospects as main national short term water priorities:
v
In domestic water supply, in
2006 95% of the total population should be able to have drinking water at home;
currently, that percentage is of 85%.
v
In relation to wastewater, in
2006 there must be 90% of the total population served with sewerage and
treatment; nowadays the percentage of population served with residual water
drainage is of 64%, with only 42% covered by treatment facilities.
v
Development of new irrigation
areas, namely the ones predicted due to Alqueva new
multi-purpose hydraulic plant in construction.
v
An increase of the agriculture
water use overall efficiency (currently still with values on a 40 to 50% range
on most of the traditional irrigation processes regions) and a decrease on
urban water supply overall losses (currently 33%).
v
To achieve a national wide
water monitoring automatic network, in order to monitor and control, namely
water quality.
v
To achieve Water Directive
Framework scheduled actions and aims.
Conclusions
Some
major problems and constraints should be emphasised, distinguishing different
water related issues and conflicts of use:
v
Several bilateral real (or
eventual) conflicts due to Portugal and Spain shared rivers and related water
issues, namely: (i) management of extreme hydrologic
situations; (ii) establishment of environmental flow regime for different
guarantee levels (humid, normal, dry and very dry years); water quality
control; inter basin water transfers; water pricing policy and water prices
differences.
v
Intense use of groundwater
resources, namely on agriculture (accounting for 65% of this sector water
consumptions), leading to an over-exploitation of the aquifers, with effects on
water quality on coastal areas due to saline intrusion.
v
High agriculture water consumption
(currently more than ¾ of all consumption and still foreseen to increase
in the near future), competing for the use of freshwater with the water supply
sector.
v
Irrigation water prices
strongly subsidised and distorted, but (according to EU policy) tending to
reflect real cost – and this will cause conflicts on a “real water price”
policy implementation on different regions and between sectors.
v
Tourism concentrated mostly on
south coastal region where (i) there is often (mostly
on dry semester) a water resources shortage, (ii) as well as deficiencies on
water supply and (iii) competition between different sector (urban and
agriculture) uses.
v
Water abstractions quality and
polluted discharges control needing to be truly improved, with measures
involving all sector uses as also as a true improvement of the (still) weak
overall effective national wastewater treatment capability and coverage.
v
Priority of uses and
environmental needs, namely on water scarcity periods, which need to be defined
and considered on water shortage contingency plans (due to be elaborated) and
be taken into account, namely on various (although quantitatively small)
internal inter-basin water transfers due to different sector water uses and
interests.
v
Water and Environmental laws,
which are currently ineffective due to (i) juridical
deficiencies, (ii) different institutions with overlapped and/or no
co-ordinated responsibilities, (iii) inexistence of legal framework (e.g., on
multiple uses plants) and (iv) to the current no-existence of a Water Law.
v
Water resources management,
which is currently (still) not made on a river basin basis and needs to be
effectively improved by means of the implementation of the recently active
River Basin Plans, making it necessary (i) to
adequate the Water Administration to that aim and (ii) to identify and create
River Basin Districts and Administrations.
Selection of
representative regions
Figure
7 presents Thornthwaite’s aridity indices in the
different river basins of mainland

Figure
7: Thornthwaite’s aridity index in mainland
Portugal
As
can be seen in figure 8 the basins that are currently facing water scarcity
problems, with the hydric balance not enabling to
guarantee water supply for different sector uses, monthly and annually, are the
ones located in the arid and sub-humid regions. That figure refers some of
those basins coastal areas as having not been covered by the evaluation study.
Nevertheless, that doesn’t mean that those areas have no problems; on the
contrary, those problems may be enhanced by that littoral position, not only
because the population and/or industry is mainly located there as also due to
tourism (mainly in


Figure
8: Scarcity of water situations. Superficial waters
Thus
the three regions selected to be candidate regions are Sado,
v
In the case of Sado, the main problems are related with the demands of
water for irrigation (due to which Sado is the
Portuguese river basin with the biggest storage capacity compared to annual
mean flow) and for industry (mainly Sines’ industry
on the coast), and also with the demands of water for energy consumption
(mainly due to cooling in thermo-electric power plants).
v
As to Guadiana’s,
the water deficit is due to the demands of water for irrigation, to the poor
quality of the water available for the various uses and to Spanish flow
regularization on summer/driest periods.
v
In the case of Ribeiras do

Figure
9: The Candidate Regions selected
These three regions will now be
characterized as to their respective sets of circumstances, affecting water
resources and management, based, basically on data of the National Water Plan,
complemented by data of the correspondent PBH of these regions.
The only available data in terms of
average household income relates to 2000 and is made by great planning regions,
thus joining namely Sado and
Referring to the pricing system, the cost
recovery and price elasticity will relate to the urban sector, looking for that
main sector characterisation and also due to the lack of reliable data for the
other sectors of activity.
Concerning to “Water Resources
Management”, the characterisation was done in “overall terms” and taking into
account IRAR regulating (envisaged) authority and municipal responsibilities.
Sado
Sado’s river basin has an area of
8295 km2 and its population is 292960 inhabitants (1998), with a population
density of about 35 inhabitants per km2, a low value when compared to Portugal
Continental territory value of 110 inhabitants per km2. The region is mostly
plain, except to some low mountains, with an overall average altitude of 127 m.
In fact, the altitudes range from 50 m to 200 m in most of the area, with a
maximum basin altitude of 501 m. Most of the area presents tertiary and
quaternary deposits with formations mainly composed by limestone and
sedimentary rocks.
The climate is
Sado has a storage capacity of 771
hm3 which makes it the Portuguese river basin with the biggest storage capacity
when compared to annual mean flow, and that reflects irrigation availability
needs. The overall availability is currently, in average, of 1618 hm3/year,
consisting of 822 hm3 of surface water (182 hm3/year in dry years) and 796 hm3
of renewable groundwater. However there will be a big increase in the
availability of surface water due to the foreseen inter basin water transfer of
about 450 hm3/year from
Surface waters are considered inadequate
to the various uses, according to the national legislation, due to its poor
quality, with pollutants loads exceeding the recommended values. In terms of
groundwater, in the monitored aquifers the quality is good. As to coastal
waters the quality is also good, with the exception of one or two polluted
spots.

Figure 10: Mean monthly precipitation and potential evapotranspiration
in Sado’s basin
Industry, animal husbandry and
non-point source loading from agriculture are the responsible for the majority
of the pollutant loads verified in Sado. The main
pollutant loads produced in Sado´s basin in
1998 were estimated as:
v
BOD5 = 22461 ton/year
v
TSS = 45281 ton/year
v
COD = 42807 ton/year
v
Total nitrogen = 5070 ton/year
v
Total phosphorus = 1361
ton/year
The percentage of population served
with water supply is currently of 97%, higher than the value correspondent to
wastewater drainage (87%), with only 56%
benefiting of treatment facilities. Urban water supply overall losses are
currently high (average of 20%), and there is a low overall efficiency in
agriculture water use (about 60%). The total annual water consumption is 1195
hm3 (600 hm3 returning back to the hydric
environment), distributed as follows: 672 hm3 of water are used in
energy production to the cooling in thermo-electric power plants, 440 hm3
in agriculture, 58 hm3 in industry (mainly Sines’
industry on the coast), and about 24 hm3 in domestic uses, with the
water uses in tourism less than 1 hm3. The percentage distribution
of water uses per sector can be seen in figure 11, whereas the percentage of
the total water use in Sado’s basin in proportion
with the water use in Portugal Continental territory can be seen in figure 12.

Figure
11: Water uses in Sado’s basin

Figure
12: Percentage of the total water use in Sado’s basin
in proportion with the water use in
Portugal Continental territory
The average household income in 2000
was 13562 €/year, with only 0.75% of this value allocated to domestic water
supply, which indicates a low water pricing (0,57 €/m3) and a low
urban water sector cost recovery (37%). This situation is much aggravated in
agricultural sector, with prices very low (0,06 €/m3) and strongly
subsidised.
There is no inter-municipal primary urban water supply system covering the basin. The (secondary) water supply distribution networks are mostly 100% (except one system, partly owned by Águas de Portugal group) of full municipal responsibility, and similar situation is due to wastewater drainage and treatment systems. Thus the pricing of water is mostly a political issue and not currently aiming cost recovery.
Table 14: Sado matrix
|
Natural conditions
and infrastructure |
Regional Context |
Climate
Type |
Cs: |
|
Aridity
Index |
AI =0.54 Dry Sub-humid |
||
|
Permanent
Population |
292960 |
||
|
Area (km2) |
8295 |
||
|
Water availability |
Total
Water Resources/ Availability (hm3) |
1630/1618 |
|
|
Trans-boundary
water |
No |
||
|
Water quality |
Quality of
surface water |
Low |
|
|
Quality
of groundwater |
Good |
||
|
Quality
of coastal water |
Good |
||
|
Water Supply |
Percentage
of supply coming from: ·
Groundwater ·
Surface water ·
Desalination, Recycling ·
Importing |
16% 84% - - |
|
|
Network
coverage: ·
Domestic ·
Irrigation ·
Sewerage |
97% 72% 87% |
||
|
Economic and Social
System |
Water use |
Water
consumption by category: ·
Domestic ·
Tourism ·
Irrigation ·
Industrial and energy production |
2.03% 0.05% 36.87% 61.05% |
|
Resources
to population index (m3/person/year) |
5564 |
||
|
Water demand |
Water
Demand trends |
Increasing |
|
|
Consumption
index |
73.3% |
||
|
Exploitation
index |
69.7% |
||
|
Pricing system |
Average
household budget for domestic water |
0.75% |
|
|
Average
household budget for agricultural water |
0,06 €/m3 |
||
|
Average
household income |
13562 €/year |
||
|
Cost
recovery |
Low |
||
|
Price
elasticity |
Low |
||
|
Social capacity building |
Public
participation in decisions |
Bad |
|
|
Public
education on water conservation issues |
Low |
||
|
Decision Making
Process |
Water Resources Management |
Water
ownership |
Public (partly private) |
|
Decision
making level (municipal, regional, national) regarding: Water
supply for each sector |
National/Municipal |
||
|
Water
resources allocation for each sector |
National |
||
|
Water Policy |
Local
economy basis |
Agriculture and industry |
|
|
Development
priorities |
Agriculture |
The climate is temperate, with rainy
winters and hot and dry summers. The average temperature is of 16 ºC, and
in the summer peak months (July and August) it varies from 23 - 26ºC. In
the coldest month (January) it varies from 8 ºC in the north of the basin
to 11 ºC in the (south) coastal areas. In this river basin temperature
reaches maxims of 41 to 44 ºC. The average annual sunshine duration is
2829 hours, with an average: maximum for July (370 hours) and minimum for
December (147 hours). The average annual precipitation is 568 mm, spatially
ranging from a minimum of 350 mm to little more than 1000 mm. Precipitation
occurs 50-80 days per year and, in volume, more than 80% of it is concentrated
in the humid semester (between October and March). As to potential evapotranspiration, the averaged yearly value is 1242 mm
and it increases in the dry semester. Figure 13 presents the mean monthly
precipitation and potential evapotranspiration in
Portuguese Guadiana’s basin territory. The total
average runoff due to that part of the basin is 1887 hm3/year,
whereas in
Portuguese Guadiana’s
water storage capacity is of 460 hm3, but this figure will be highly
increased due to Alqueva new multi-purpose hydraulic
plant (still in construction), which will account for a (useful) storage
capacity of 3,150 hm3. Although currently a 30 hm3 inter
basin water transfer from this basin to

Figure
13: Mean monthly precipitation and potential evapotranspiration
in
Guadiana’s basin
In terms of water availability, in
average, it is currently of 3373 hm3/year, consisting of 2944 hm3 of surface
water (1001 hm3/year in dry years) and 429 hm3 of renewable groundwater. It
must be emphasised that
Surface waters are considered
inadequate to the various uses, according to the national legislation, due to
its poor quality as they are the receptors of the pollution caused mostly by
The main pollutant loads produced in Guadiana´s basin in 1998 were estimated as:
v BOD5 = 17389 ton/year
v TSS = 17849 ton/year
v COD = 26250 ton/year
v Total nitrogen = 7019 ton/year
v Total phosphorus = 1600 ton/year
The percentage of population served
with water supply is currently of 84% and a similar percentage (83%) applies to
wastewater drainage, but only 67% benefit from treatment facilities. There is a
low overall efficiency in agriculture water use (about 60%). The total annual
water consumption is 419 hm3 (with about 98 hm3 returning back to the hydric environment), with the following distribution: about
400 hm3 of water are used in agriculture, 14 hm3 in domestic uses, 3.3 hm3 in
industry, and in tourism about 1.65 hm3. The percentage distribution of water
uses per sector can be seen in figure 14, whereas the percentage of the total
water use in
Figure
14: Water uses in
Guadiana’s basin

Figure 15: Percentage of the total water use in Guadiana’s basin in proportion with the water use in Portugal Continental territory
The average household income in 2000 was 13562 €/year, with only 0.89% of this value allocated to domestic water supply, which indicates the low water pricing (0,70 €/m3), although much higher than for irrigation water (0,06 €/m3), which is strongly subsidised, as already referred. The cost recovery is correspondingly low (23% in the urban water sector).
Agriculture is (even if indirectly)
the most important economic activity in the region, with the viticulture sector
assuming high importance and contributing to the increase of the tertiary
sector in the region.
There is a recent inter-municipal urban (main) water supply and wastewater drainage and treatment systems’ company (Águas de Portugal group) that only “covers” the northern part of the basin. Thus the pricing of water is mostly (still) a political issue and not currently aiming cost recovery.
Table 15: Guadiana matrix
|
Natural conditions
and infrastructure |
Regional Context |
Climate
Type |
Csa
:Mediterranean Temperate |
|
Aridity Index |
AI
=0.46 Semi- Arid |
||
|
Permanent
Population |
182580 |
||
|
Area (km2) |
11601 |
||
|
Water availability |
Total
Water Resources/ Availability (hm3) |
3401/ 3373 |
|
|
Trans-boundary
water (hm3/year) |
1000 |
||
|
Water quality |
Quality
of surface water |
Low |
|
|
Quality
of groundwater |
Low |
||
|
Quality
of coastal water |
Good |
||
|
Water Supply |
Percentage
of supply coming from: ·
Groundwater ·
Surface water ·
Desalination, Recycling ·
Importing |
43.4% 56.1% - 0.5% (1) |
|
|
Network
coverage: ·
Domestic ·
Irrigation ·
Sewerage |
84% 76% 83% |
||
|
Economic and Social
System |
Water use |
Water
consumption by category: ·
Domestic ·
Tourism ·
Irrigation ·
Industrial and energy production |
3.35% 0.39% 95.47% 0.79% |
|
Resources
to population index (m3/person/year) |
18627 |
||
|
Water demand |
Water
Demand trends |
Increasing |
|
|
Consumption
index |
12.3% |
||
|
Exploitation
index |
11.7% |
||
|
Pricing system |
Average
household budget for domestic water |
0.89% |
|
|
Average
household budget for agricultural water |
0,06 €/m3 |
||
|
Average
household income |
13562 €/year |
||
|
Cost
recovery |
Low |
||
|
Price
elasticity |
Low |
||
|
Social capacity building |
Public
participation in decisions |
Bad |
|
|
Public
education on water conservation issues |
Low |
||
|
Decision Making
Process |
Water Resources Management |
Water
ownership |
Public (partly private) |
|
Decision
making level (municipal, regional, national) regarding: Water
supply for each sector |
National/Municipal |
||
|
Water
resources allocation for each sector |
National |
||
|
Water Policy |
Local
economy basis |
Agriculture and Services |
|
|
Development
priorities |
Agriculture |
(1)
Imported from Sado’s basin (2 hm3)
Ribeiras do
Ribeiras do Algarve river basin covers an area of 3837 km2 and
its population is 324100 inhabitants (1998), with a population density of about
84 inhabitants per km2, a value still smaller than the average for
Portugal Continental territory (110 inhabitants per km2) but the
greatest among all southern (of Tejo) river basins,
namely Sado and Guadiana.
The region is mostly plain, with altitudes ranging from 0 to 100 m, and only a
few spots above these values. Most of the area presents formations mainly
composed by volcanic rocks (especially basalts).
The climate is

Figure
16: Mean monthly precipitation and potential evapotranspiration
in Ribeiras do
Algarve basin
The overall water availability is
currently, in average year, of 570 hm3/year, consisting of 298 hm3
of surface water (104 hm3/year in dry years) and 272 hm3
of exploitable ground water.
Surface water presents quality problems, as rivers have almost no flow in dry period and receive the pollution caused by urban areas and agriculture. Dam storage reservoirs assume a high importance in water supply due to that fact, but also some quality problems occur on it, especially in the summer. The same can be applied to groundwater with parameters like calcium, sodium, chlorides and nitrates exceeding the maximum acceptable values for drinking water and irrigation water. As to coastal waters the quality is good, with the exception of one or two polluted spots.
The main pollutant loads are mostly
generated by urban wastewater, animal husbandry and non-point source loading
from agriculture. The loads produced in Ribeiras do
v BOD5 = 11678 ton/year
v TSS = 17492 ton/year
v COD = 12091 ton/year
v
Total nitrogen = 2473 ton/year
v
Total phosphorus = 647 ton/year
The percentage of population served with water supply is currently of 82%, higher than the value correspondent to wastewater drainage (73%), with only 72% benefiting of treatment facilities. Urban water supply overall losses are currently high (with an average of 37%) and there is a low overall efficiency in agriculture water use (about 60%). The total annual water consumption is 340 hm3 (about 95 hm3 returning back to the hydric environment), distributed as follows: 305 hm3 of water are used in agriculture, 21.8 hm3 in domestic uses, 10 hm3 in tourism, and in industry about 2.4 hm3. The percentage distribution of water uses per sector can be seen in figure 17, whereas the percentage of the total water use in Ribeiras do Algarve basin in proportion with the water use in Portugal Continental territory can be seen in figure 18.
Water shortage occurs in the summer period, when the demands of water are higher, once this is an area that attracts a large number of tourists (currently estimated as 780,000, more than twice the permanent population) and also with strong needs of water for irrigation. Thus the conflict of uses of water between the two sectors.
Figure
17: Water uses in Ribeiras do
Algarve basin
Figure
18: Percentage of the total water use in Ribeiras do
Algarve basin in proportion with the
water use in Portugal Continental territory
The average household income in 2000 was 13573 €/year, with only 0.90% of this value allocated to domestic water supply, which indicates a low water pricing (0,68 €/m3), although much higher than for irrigation water (0,07 €/m3), which is strongly subsidised as already referred. The cost recovery is correspondingly low (40% in the urban sector).
Ribeiras do
Table 16: Ribeiras do Algarve matrix
|
Natural conditions
and infrastructure |
Regional Context |
Climate
Type |
Cs: |
|
Aridity
Index |
AI =0.68 |
||
|
Permanent
Population |
324100 |
||
|
Area (km2) |
3837 |
||
|
Water availability |
Total
Water Resources/ Availability (hm3) |
540/570 |
|
|
Trans-boundary
water |
No |
||
|
Water quality |
Quality
of surface water |
Low |
|
|
Quality
of groundwater |
Low |
||
|
Quality
of coastal water |
Good |
||
|
Water Supply |
Percentage
of supply coming from: ·
Groundwater ·
Surface water ·
Desalination, Recycling ·
Importing |
71.5% 19.6% - 8.9% (1) |
|
|
Network
coverage: ·
Domestic ·
Irrigation ·
Sewerage |
82% 77% 73% |
||
|
Economic and Social
System |
Water use |
Water
consumption by category: ·
Domestic ·
Tourism ·
Irrigation ·
Industrial and energy production |
6.43% 2.90% 89.96% 0.71% |
|
Resources
to population index (m3/person/year) |
1666 |
||
|
Water demand |
Water
Demand trends |
Increasing |
|
|
Consumption
index |
62.8% |
||
|
Exploitation
index |
56.6% |
||
|
Pricing system |
Average
household budget for domestic water |
0.90% |
|
|
Average
household budget for agricultural water |
0,07 €/m3 |
||
|
Average
household income |
13573 €/year |
||
|
Cost
recovery |
Low |
||
|
Price
elasticity |
Low |
||
|
Social capacity building |
Public
participation in decisions |
Bad |
|
|
Public
education on water conservation issues |
Low |
||
|
Decision Making
Process |
Water Resources Management |
Water
ownership |
Public (partly private) |
|
Decision
making level (municipal, regional, national) regarding: Water
supply for each sector |
National/Municipal |
||
|
Water
resources allocation for each sector |
National |
||
|
Water Policy |
Local
economy basis |
Tourism |
|
|
Development
priorities |
Tourism and Agriculture |
(1)
Imported from
Sources and
References
v
Aires, C. Mineiro,
2001. “The Institutional Framework for Water in
v
INAG, 2001. Plano Nacional da Água
(National Water Plan), MAOT,
v
INAG, 2000. (15) Planos de Bacia dos Rios Nacionais (Portuguese River Basin Plans), Inag,
v
Maia, R., 1999. “Portuguese-Spanish Rivers Basins: Bilateral Agreements’
Evolution and Context”, Water Science & Technology “Environmental
Challenges for the Next Millennium”, IWA Publishing, Vol. 42, NI- 2 2000
Annex
General Overview of Mainland
River Basins
Range of circumstances in Mainland River Basins of
Table
17: Overview of the river basins of the country
|
River Basin |
Area (km2) |
Population (1998) |
Climate |
Altimetry |
|||
|
Average Temperature (ºC) |
Precipitation (mm/year) |
Evapotranspiration (mm) |
Runoff (hm3/yr) |
||||
|
|
818 |
82760 |
10 |
1954 |
652 |
1059 |
Altitudes ranging from 0 m to 1400 m with
several mountains especially in the interior |
|
|
1566 |
167740 |
12 |
2208 |
819 |
1629 |
Average altitude: 374 m Maximum altitude: 1415 m Altitudes 0 - 450 m: 68% Altitudes |
|
Cávado |
1699 |
450890 |
12 |
2172 |
852 |
2099 |
Average altitude: 542 m Maximum altitude: 1545 m Altitudes 0 - 150 m: 31% Altitudes Altitudes |
|
Ave |
1459 |
551550 |
13 |
1830 |
907 |
1228 |
Average altitude: 268 m Maximum altitude: 1260 m Altitudes 0 - 280 m: 60% Altitudes |
|
Leça |
236 |
271100 |
13 |
1334 |
772 |
104 |
Average altitude: 124 m Maximum altitude: 531 m Altitudes 0 - 150
m: 76% Altitudes >
200 m: 13% |
|
Douro |
18854 |
1932700 |
15 |
1016 |
521 |
9192 |
Altitudes ranging from 0 m to 1400 m,
increasing from the coastal areas to the interior |
|
Vouga |
3706 |
702660 |
14 |
1532 |
718 |
1908 |
Altitudes ranging from 0 m to 1100 m,
increasing from the coastal areas to the interior |
|
Mondego |
6878 |
693390 |
12 |
1181 |
665 |
3430 |
Altitudes ranging from 0 m to 2000 m ( |
|
Lis |
1009 |
180060 |
15 |
964 |
654 |
260 |
Altitudes ranging from 0 m to 200 m. |
|
Ribeiras
do Oeste |
2395 |
803970 |
14 |
884 |
639 |
300 |
Altitudes ranging from 0 m to 600 m (most of the
areas 0 m to 200 m) |
|
Tejo |
25161 |
2812850 |
14,9 |
821 |
632 |
6164 |
Altitudes ranging from 0 m to 2000 m ( |
|
Sado |
8295 |
292960 |
16 |
622 |
467 |
972 |
Average altitude: 127 m Maximum altitude: 501 m Most of the areas have altitudes that range
from 50 m to 200 m |
|
Mira |
1767 |
23950 |
16 |
689 |
496 |
196 |
Altitudes ranging from 0 m to 400 m,
increasing from the coastal areas to the interior |
|
|
11601 |
182580 |
16 |
568 |
401 |
1887 |
Average altitude: 237 m Maximum altitude: 1027 m Most of the areas have altitudes that range
from 100 m to 400 m |
|
Ribeiras
do Algarve |
3837 |
324100 |
18 |
840 |
630 |
348 |
Altitudes ranging from 0 m to 100 m, with few
spots above these values |