Report on the Israeli Water Economy: General Description and Data
Introduction and General Background
Existing Conditions of
The Israeli water economy is in the midst of a severe
crisis whose main features are:
1. Freshwater[1] deficit:
Emanating from a decline in sources (
2. Deterioration of water quality: Continual salination of the coastal aquifer due
to seawater intrusion caused by over-pumping. The over pumping caused a severe
decline in the water levels. This is particularly prominent in the
3. Environmental crisis: The rivers and the
·
Over-pumping of the aquifers, resulting in water level
decline and salinity.
·
Some
decline in the natural renewal of the aquifers due to climatic changes in the
eastern Mediterranean region. The observed phenomena include:
1. Increase in extremes and differences: More drought years,
more very rainy years, and fewer years with average precipitation.
2. Reduction in precipitation in northern
4. "Hydropolitics” – The Israel water
system is very vulnerable to public-political pressure, with the agricultural
lobby in the forefront.
5. Population growth and economic development, resulting in
increased domestic and industrial consumption. These demands are rigid and have
not been accompanied by an increase of sources and/or a reduction of the more
flexible needs of the agricultural sector.
6. Increase in the demands of neighboring entities following
political agreements (Jordan and the Palestinian Authority (PA)).
7. Public-political-economic debate regarding water allocation
and pricing: Essentially, the debate is divided between the economic approach
(Ministry of Finance) that calls for allocation based on a price system that
includes the shadow price of water on the one hand, and the agricultural sector
that requests quota-based allocations and water price adjustments based on
ability to pay, i.e., subsidy, on the other hand. In practice, a combined and
non-uniform allocation system developed, based on tiered prices and quotas.
8. Continuing impotence of the regulator – the Water
Commission (linked to hydropolitics). In 1996 the Water Commission was
transferred from the Ministry of Agriculture to the Ministry of Infrastructure.
The purpose of this transfer, inter alia, was to reduce sectoral considerations on the water economy. The
move had limited effect and did not prevent the crisis.
9. Noncompetitive structure of the system for allocating water
to consumers – the strong centralized system of the government company, Mekorot, and its powerful workers’
committee. Mekorot supplies more
than half the water in
10.
Divergence among the government and the public authorities
that control the water economy (with obvious conflict of interests arising among
them).
11.
Lack of
synchronization of the different needs that the water economy has to
fulfill.
12.
Neglect, apathy, lack of awareness and minimal enforcement
regarding environmental-ecological concerns.
An analysis of the processes that characterize
·
The main quantitative expression of the crisis is the
severe reduction in the ability to produce freshwater from the aquifers (approx.
500MCM) without operating additional wastewater reclamation systems and
desalination plants.
·
The agricultural sector bears the brunt of the cuts (since
the demand of the other sectors is rigid). Its allocation was recently reduced
by about 40%.
·
The strategy for stabilizing the water economy is based on
intensifying desalination of seawater and reclaiming wastewater for agricultural
purposes. At the same time, hydrological rehabilitation of the natural aquifers
(reduction of the hydrological deficits) will not allow increased pumping as was
customary prior to the crisis, and apparently one of its causes.
·
These processes have implementation limitations.
Consequently, in the medium term the water mix at the disposal of the
agricultural sector will be altered (which will influence its geographical
distribution) and its overall consumption will not increase.
·
In the long term, assuming that reasonable quantities will
be desalinated, the agricultural sector will only revert to its pre-crisis
size.
·
The significance for the agricultural sector is a sharp
drop in fresh water allocated for export crops, particularly:
|
Citrus |
120 MCM |
|
Cotton |
70 MCM |
|
Avocado and others |
10 MCM |
|
Total reduction |
200 MCM |
These crops use mainly recycled wastewater. The water made
available by reducing these crops can be redirected for growing vegetables for
the local market and feed for dairy farming.
As a result of the population growth and the stagnation of
crop yields (in comparison to the pre-crisis years), fresh vegetable food
imports will probably increase.
A brief description of Israel
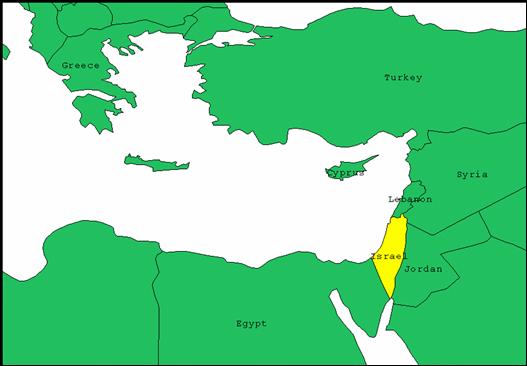
Map No. 1. Geographic
location of Israel
The hills of
Extending about 195 km along the Mediterranean, the coastal
plains range from a width of less than 1 km to a maximum of about 32-km. They
consist of the Plain of Zevulun,
extending about 16 km north of Haifa along the Bay of Haifa; the Plain of
Sharon, extending south from the vicinity of Haifa to Tel Aviv; and the Plain of Judea,
from Tel Aviv to the city of Gaza. The coastal plains contain most of
The
The chief
The coastline of
The climate of
Climatic Indicators
|
Region |
Average temperature (°C) |
Precipitation (mm rain) | |
|
|
Winter |
Summer |
1998-1999 |
|
Coastal: 1. North 2. Center 3. South |
13° 14° 15° |
27° 27° 27° |
534 284 157 |
|
Mountain: 4. 5. |
9° 9° |
25° 26° |
453 264 |
|
Valleys: 6. Jezreel 7 Hula 8. Beit Shean |
15° 15° 17° |
28° 28° 30° |
345 261 106 |
|
Southern: 9. Beer-Sheva 10. Eilat |
17° 22° |
28° 32° |
64 25 |
Population
Population data
(Source: New Master Plan for the Water Economy of Israel,
January 2002, hereinafter: (1) )
|
Year |
Population (millions) |
Annual Rate of Increase |
|
1998 |
6.041 |
|
|
2000 |
6.200 |
1.3% |
|
2010 Projected |
7.295 |
1.6% |
|
2020 Projected |
8.600 |
1.6% |
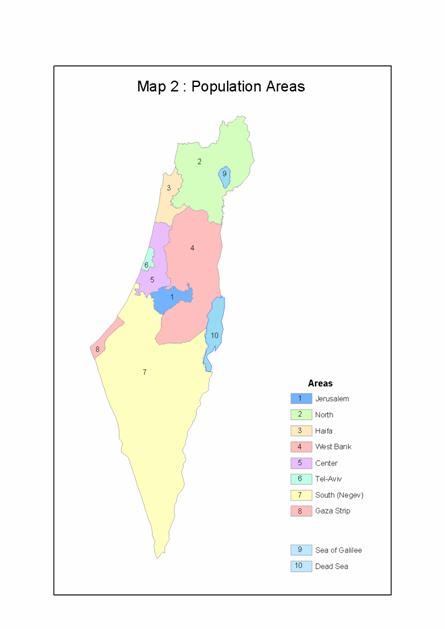
Geographic distribution of
population
Source: Statistical Abstract of
|
District |
Population |
Area of District | ||
|
|
(Thousands) |
% |
Sq. kilometers |
% |
|
1. |
711 |
11 |
652 |
3 |
|
2. North |
1042 |
16 |
4478 |
21 |
|
3. |
840 |
13 |
863 |
4 |
|
4.Center |
1530 |
24 |
1276 |
6 |
|
5. Tel Aviv |
1301 |
20 |
171 |
1 |
|
6. South |
841 |
13 |
14231 |
65 |
|
7. |
172 |
3 |
|
|
|
TOTAL |
6437 |
100% |
21671 |
100% |
* Jewish population only
Distribution of population by type
of settlement
|
Type of Settlement |
Population (in millions) | |
|
|
Millions |
% |
|
3 metropolitan areas (Pop. exceeding 200,000) |
1.5 |
23 |
|
9 big cities (Pop. 100,000-200,000) |
1.4 |
21 |
|
Mid-sized cities (Pop. 20,000-100,000) |
1.7 |
26 |
|
Small towns and cities (Pop. 2,000-20,000) |
1.2 |
19 |
|
Villages and communities |
0.7 |
11 |
|
TOTAL |
6.4 |
100% |
Economic Indicators
General
characteristics
The Israeli Economy – Facts and
Figures*, 1986 to 2001
(Source: Bank of
|
|
1986-1989 |
1990-1992 |
1993-1996 |
1997-1999 |
1999 |
2000 |
2001 |
|
Average population (thousands) |
4407 |
4911 |
5473 |
5974 |
6121 |
6283 |
6437 |
|
Population growth rate (%) |
1.6 |
4.3 |
2.6 |
2.5 |
2.5 |
2.6 |
2.4 |
|
Employed Israelis (thousands) |
1420 |
1573 |
1900 |
2083 |
2137 |
2221 |
2270 |
|
|
|
|
|
|
|
|
|
|
GDP (in billions of |
260 |
307 |
373 |
429 |
429 |
468 |
465 |
|
GDP growth rate (%) |
3.6 |
6.4 |
5.5 |
2.9 |
2.6 |
6.4 |
-0.6 |
|
GDP/capita (in thousands of US$, current prices) |
8.7 |
12.1 |
15.1 |
17.1 |
16.7 |
17.9 |
17.2 |
|
|
|
|
|
|
|
|
|
|
Unemployment rate (%) |
7.1 |
10.5 |
7.8 |
8.3 |
8.9 |
8.8 |
9.3 |
|
Inflation rate (over the year, %) |
18.2 |
15.0 |
11.1 |
5.6 |
1.3 |
0.0 |
1.4 |
|
|
|
|
|
|
|
|
|
|
Current account deficit (% of GDP) |
0.2 |
1.1 |
4.8 |
2.7 |
2.9 |
1.2 |
1.5 |
|
Foreign currency balances (in billions of $) |
5.2 |
6.2 |
8.6 |
22.3 |
23.2 |
23.8 |
24.1 |
|
Net foreign debt (% of GDP) |
47.0 |
28.5 |
24.2 |
12.2 |
9.9 |
6.4 |
3.9 |
* Annual averages
The business sector in
Source: Bank of
|
Sector |
Percentage of GDP |
|
Industry |
23.9% |
|
Agriculture and gardening |
3.3% |
|
Transportation and communications |
12.2%* |
|
Construction |
6.6% |
|
Commerce and services |
51.2% |
|
Electricity and water |
2.8%* |
|
TOTAL |
100.0% |
* Infrastructure sectors
Division into Water Regions
In principle,
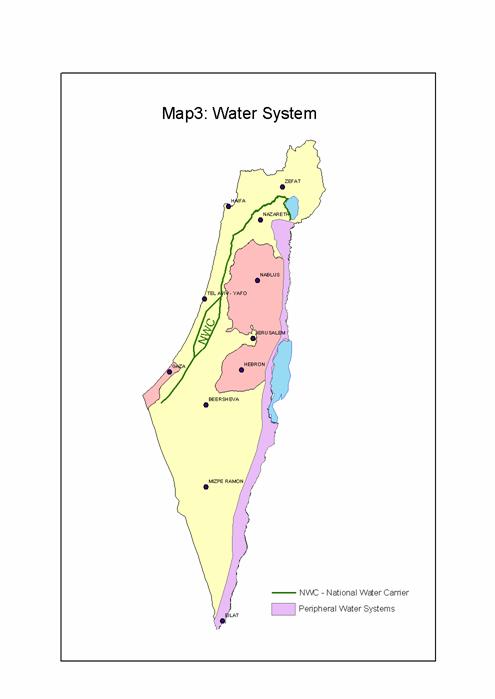
Freshwater
The National Water Carrier (NWC) connects all major sources of freshwater into a
single network (see Map 3). Water can be transferred from one region to another,
so that water from one aquifer may be used in a different geographical region.
In addition to the NWC which
transfers water from the
·
Connection of the coastal aquifer (in the west) to the
·
Connection of the NWC to the Northern Coastal Plain and
·
Connection of the
Recycled water
The Shafdan,
a plant for the treatment of urban and industrial effluent of the greater Tel
Aviv metropolitan area (which includes more than 30% of the country’s
population), is responsible for transferring recycled water to the southern
region (Western and
Two large additional networks convey recycled effluent from
the
Pricing policy
Water prices by quality and sector (agricultural,
industrial, urban) are more or less uniform throughout the country.
However, for the sake of convenience only two sub-regions,
Tel-Aviv and the Arava, were
selected for the current study. Detailed description of these regions is
presented in section G below.
Water institutions
According to the Water Law of 1959, all water in
Some 65% of the water in
A small number of regions are not linked to any of the
aforesaid water systems. They are mainly in the east, and include the
Water Demand and Supply
Water Demand
Domestic Demand for Water (MCM/year) (1)
|
Year |
m3 / capita |
National System Demand |
Peripheral System Demand |
Total Demand |
|
1998 |
115 |
669 |
25 |
694 |
|
2000 |
110 |
659 |
25 |
684 |
|
2002 Estimate |
108 |
655 |
25 |
680 |
|
2010 Projected |
120 |
844 |
31 |
875 |
|
2020 Projected |
130 |
1080 |
40 |
1120 |
Industrial Demand for Water (MCM/year)(1)
|
Year |
Freshwater |
Saline Water |
Recycled Water |
Total | ||
|
|
National System Demand |
Peripheral System Demand |
Total Demand |
|
|
|
|
1998 |
91 |
2 |
93 |
36 |
0.2 |
129 |
|
2000 |
93 |
2 |
95 |
37 |
0.2 |
132 |
|
2002 Estimate |
92 |
2 |
94 |
37 |
0.4 |
131 |
|
2010 Projected |
107 |
3 |
110 |
44 |
13.0 |
167 |
|
2020 Projected |
126 |
4 |
130 |
51 |
16.0 |
197 |
Agricultural Consumption
Background
a. The agricultural sector bears the brunt of the drastic cuts
in water supply mandated by the water crisis and the decline in freshwater
supply from 1998 to 2002. (1998 represents an average year, and data for 2002
reflect the situation after several drought years.)
b. The government has decided to allocate 1150 MCM/year to the agricultural sector,
composed of 530 MCM/year
freshwater and the rest, recycled and saline water.
c. It is estimated that the aquifer deficit and Mekorot’s ability to develop new water
(desalination and recycling) will enable achieving the aforesaid goal only in
2010.
d. Future agricultural demand will probably be strongly
affected by the extent to which the suggested price reforms are applied.
e. The agricultural demand for recycled water will be affected
by quality (see below).
f.
The following balances do not include floodwaters. (An
average of 15 MCM/year, according
to current catchment and
reservoir capacities).
Agricultural Consumption (MCM/year)
Sources: (1) and data from
the Consumption Division of the Israel Water Commission (hereinafter: (2) ). See Map No. 3
|
|
|
1998 |
2000 |
2002 |
2005 |
2010 |
|
National System |
Fresh |
774 |
651 |
270 |
470 |
470 |
|
|
Recycled |
269 |
270 |
279 |
339 |
409 |
|
|
Saline |
30 |
30 |
30 |
30 |
30 |
|
|
Total |
1073 |
951 |
579 |
839 |
909 |
|
Peripheral System |
Fresh |
86 |
81 |
82 |
71 |
60 |
|
|
Recycled |
7 |
9 |
16 |
27 |
36 |
|
|
Saline |
160 |
162 |
160 |
160 |
160 |
|
|
Total |
253 |
252 |
258 |
258 |
256 |
|
TOTAL |
Fresh |
860 |
732 |
352 |
541 |
530 |
|
|
Recycled |
276 |
279 |
295 |
366 |
445 |
|
|
Saline |
190 |
192 |
190 |
190 |
190 |
|
|
TOTAL |
1326 |
1203 |
837 |
1097 |
1165 |
Seasonal Distribution: Summer consumption (May – September): 65% of the annual
consumption in a regular year and 60% in a drought year.
Notes:
1. 1998 serves as the representative year for the 1990’s
decade.
2. 1999 to 2001 were drought years with minimal
precipitation.
3. 2002 is an average rainfall year, but the hydrological
crisis is very evident because of the paucity of the aquifer reserves and the
severity of salinity, due to over-pumping during the previous drought years. The
year 1999 (drought year) had a balance similar to that of 1998.
4. In general, the shortage is not only a function of the
precipitation level of a specific year, but mostly, a consequence of the pumping
policy for the aquifers in past years.
Additional Consumption: Water
Allocations for the Environment, Landscape and River Rehabilitation
Freshwater: In the current state of drought and water
scarcity, there is no allocation of water for environmental enhancement and the
natural flow in almost all the rivers is practically nonexistent. This is a
consequence of the extremely low aquifer level.
Recycled wastewater:
·
Currently about 15 MCM/year are utilized for river rehabilitation, 85%
of which are recycled for agricultural irrigation.
·
The government has decided to increase this amount to 40-50
MCM/year, 75% of which will be
restored to the water economy.
Additional Consumption:
According to the peace agreement with
·
35 MCM/year
from the Beit Shean springs.
·
20 MCM/year
restoration of
Note: In years of shortage, taken from the Israeli source
in the
The agreement with the PA calls for:
·
31 MCM/year
from the national system: (Mountain Aquifer).
·
4 MCM/year
from other sources.
Total= 35 MCM/year
·
In addition, the PA pumps 27 MCM/year from the Mountain Aquifer.
Note: We estimate that these quantities will have to be
significantly increased in the future. According to the Master Plan (1), a growth rate of 4.3%/annum is anticipated and
it is reasonable to assume that demand will increase accordingly.
Total net supply to Jordan and the Palestinian Authorities
– 97 MCM/year.
Summary of Water Demand (MCM/year)(1) +
(2)
Summary by Water Type
|
|
|
1998 |
2000 |
2002 (estimate) |
2010 (projected) |
|
National system |
Fresh |
1629 |
1495 |
1106 |
1609 |
|
|
Recycled |
269 |
270 |
279 |
457 |
|
|
Saline |
30 |
30 |
30 |
30 |
|
|
Total |
1928 |
1795 |
1415 |
2095 |
|
Peripheral System |
Fresh |
120 |
113 |
114 |
100 |
|
|
Recycled |
7 |
9 |
16 |
52 |
|
|
Saline |
196 |
199 |
197 |
159 |
|
|
Total |
323 |
321 |
327 |
311 |
|
Total |
Fresh |
1749 (78%) |
1608 (76%) |
1220 (70%) |
1709 (71%) |
|
|
Recycled |
276 (12%) |
279 (13%) |
295 (17%) |
509 (21%) |
|
|
Saline |
226 (10%) |
229 (11%) |
220 (13%) |
189 (8%) |
|
|
TOTAL |
2251(100%) |
2116 (100%) |
1735 (100%) |
2407 (100%) |
Summary of Water Demand by Sector
|
|
1998 |
2000 |
2002 (estimate) |
2010 (projected) |
|
Domestic |
694 31% |
684 32% |
680 39% |
875 36% |
|
Industrial |
129 6% |
132 6% |
131 8% |
167 7% |
|
Agricultural |
1326 59% |
1204 57% |
837 48% |
1165 48% |
|
Environment |
4 - |
2 - |
2 |
40 2% |
|
Jordan & PA |
98 4% |
94 4% |
85 5% |
160 7% |
|
TOTAL |
2251 100% |
2116 100% |
1735 100% |
2407 100% |
Water Supply
Freshwater
There are seven major freshwater basins: six are
underground aquifers and the seventh is the
Salination Levels and Long-Term Average Recharge by Water
Resource (see Map No. 4)
Source: Israeli Geological Service, Hydrological report,
2000
|
Basin |
Salination Level (mgchlorine/liter) |
AverageAnnual-Recharge (MCM) |
|
|
1.Coastal Aquifer |
190-320 |
300 |
|
|
2.Mountain Aquifer |
210 |
360 |
|
|
3. |
180 |
550 |
|
|
4. |
250 |
90 |
|
|
5. |
250 |
40 |
|
|
6. |
320 |
90 |
|
|
7.Eastern Mountains |
150 |
60 |
|
|
TOTAL |
|
1490 |
|

Desalinated Water
Desalinated seawater:
Currently, the desalination plant in Eilat produces 3-5 MCM/year, using water from the
Desalination of saline water (from salinated aquifers and wells): Currently 1-3 MCM/year are being treated, and in the
coming years desalination of an additional 40 MCM/year is planned.
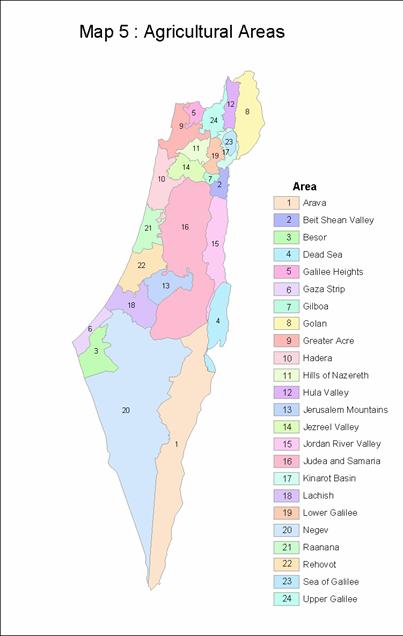
Recycled Water
Following is a list of the main facilities for recycling
wastewater. All of them are partially or wholly owned by Mekorot. (see Map No. 5)
|
Facility |
Water source |
Agri./other consumption
region |
MCM 2002 2010 (est.)(project.) |
Current treatment quality |
Notes | |
|
Shafdan |
Greater Tel-Aviv area |
Western, Northern and |
110 |
140 |
Tertiary + |
Allowed for incidental drinking |
|
|
Greater |
Western Jezreel Valley |
30 |
45 |
Secondary+ |
|
|
|
|
Judean mts., Judean plains & |
15 |
20 |
Tertiary |
|
|
|
Netanya |
Hefer Valley |
8 |
12 |
Tertiary |
|
|
Hadera |
Hadera |
Coastal plain & |
7 |
10 |
Secondary+ |
|
|
TOTAL |
|
|
170 |
227 |
|
|
|
% of total wastewater |
|
|
52% |
45% |
|
|
An additional 25 small and intermediate sized sewage
treatment installations are in operation. Their treatment quality is generally
“Secondary”.
Additional notes: It is estimated that about 100 MCM/year currently flow into the sea.
The possibility of using a large quantity of recycled wastewater for
agricultural purposes is dependent on upgrading it to a quarternary quality level (suitable for all crops),
decreasing the salinity level (desalination of wastewater or the water entering
the city), and pooling the water recycled in the winter for consumption in
summer. Upgraded quality is also needed for river rehabilitation.
General Water Balance (MCM/year)(1) + estimates
The supply and the demand mix are presented for a normal
year selected from the past decade, a year during the current hydrological
crisis, and an average year in the future:
|
|
Normal year (1998) |
Drought year (2002 estimate) |
Future average year
(2010) |
|
Demand by sector: |
|
|
|
|
Domestic |
694 |
680 |
875 |
|
Industrial |
129 |
131 |
167 |
|
Agricultural |
1326 |
837 |
1165 |
|
Jordan & PA |
97 |
86 |
160 |
|
Environment |
5 |
1 |
40 |
|
Total |
2251 |
1735 |
2407 |
|
|
|
|
|
|
Demand by water type: |
|
|
|
|
Freshwater |
1749 |
1248 |
1709 |
|
Reclaimed |
276 |
298 |
509 |
|
Saline |
226 |
189 |
189 |
|
Total |
2251 |
1735 |
2407 |
|
|
|
|
|
|
Supply: |
|
|
|
|
Aquifers (including saline) |
1975 |
1432 |
1398 |
|
Desalination |
- |
5 |
500 |
|
Recycled |
276 |
298 |
509 |
|
Total |
2251 |
1735 |
2407 |
Water Quality
Water quality is measured according to the following:
·
Salinity – refers to the chlorine level in the
water (indicated by electrical conduction capacity).
·
The presence or absence of chemicals and poisonous
contaminants, especially boron, whose presence has a negative impact on
crops.
·
The level of biological purity (T.S.S., B.O.D.).
The current trend calls for stricter adherence to water
purity standards. An inter-ministerial committee (Inbar Committee) of director-generals recently
issued a report recommending substantially stricter purification standards for
recycled wastewater.
Water quality is multifaceted and has many implications,
including:
a. Water quality for domestic and
industrial consumption – standards and costs.
During shortages it is possible to use high-quality
wastewater for some of these purposes: irrigating public parks, certain
industrial uses, etc. (some households in
When salinity standards are introduced into water
purification standards some towns will have to debate the economic-structural
issue of the “location” for removing salts, i.e., desalination at the “city
gates” or desalination of the wastewater at the “exit”.
b.
Water quality for agricultural
consumption – Factors influencing the possibility of irrigating crops
with wastewater include:
·
Ministry of Health requirements.
·
Salinity level as per the flora-agricultural
requirements.
The salinity level is a function of the water’s salinity
“at the city gates” (entry water), with an added 70-100mg chlorine/liter.
It is important to note that as more desalinated water
becomes part of the
·
The environmental impact of using recycled wastewater,
particularly in sensitive areas above aquifers. Such use must be approved by the
Ministry of the Environment and the Health Ministry.
Also to be taken into account is the environmental impact
of drainage to the rivers in terms of the biological purity level.
Notes:
·
Some salinity problems may be solved by diluting saline
water with fresh or desalinated water.
·
The standards for recycled wastewater at the sewage
treatment facility exit are currently being updated and expanded
(Director-generals Committee, Inbar Committee).
·
Boron – Crops are particularly sensitive to boron. In some
areas the recycled wastewater is rich in boron due to the water entering the
city from wells with high boron concentrations. This is an acute problem,
particularly in the southern Arava and the date plantations there since Eilat’s wastewater is its main water
source. Most of Eilat’s water
comes from desalinated
c.
The interface between water quality
and various environmental issues
A major part of the hydrological crisis is also an
environmental crisis, with continuous pollution of the rivers, aquifers and
other natural resources. Serious ecological damage affecting unique natural
resources and landscapes often result.
·
Technically, treated sewage may be used for agricultural
purposes, diverted to rivers or the sea or a combination of them.
The effect of diverting the treated sewage on the
“receiving” environment and the subsequent environmental demands affect the
technology and the development of water treatments.
Agricultural use of wastewater above an aquifer may
contaminate it, in turn arousing the issue of sustainable water resources and
the problem of creating (or preventing) damage for generations to come.
Dumping in rivers may influence their flora and fauna. Fish
and other animals are extremely sensitive to chlorine.
The Barcelona Accord of the Mediterranean countries
restricts drainage to the sea.
·
The effect on the
The amount of water pumped from the
The crisis of the
d.
Economic Facets of the Issue of
Quality
The demand for a higher level of water quality has clear
economic implications. The debate focuses on who is to carry the financial
burden of upgrading the water treatment plants: the local authorities based on
the principle that the “polluter pays”, the farmers, the consumers or the
government (representing social-environmental interests).
The indecisiveness on these important matters and the
resulting imbalance between sewage supply and treatment, together with
agricultural demands and drainage solutions, are some of the reasons for the
slow transition by farmers to recycled wastewater and is part and parcel of the
overall crisis.
Public regulation and Institutional structure
Description
The following is a partial description of the entities
involved in regulating and allocating resources to the water economy.
The large number of parties involved is most apparent, as
are the implications of the subsequent bureaucratic maze that hinders initiative
and change.
|
Entity |
Regulatory and Implementation
Authority |
|
1. Water Commission (Min. of Infrastructure) (Until
1996-Min. of Agriculture) |
·
Aquifer pumping policy (Operations Comm. of the
Hydrological Service) ·
National & regional planning of installations
(Planning Division), and desalination tenders ·
Allocation of quotas for all water types (Consumption
Division) ·
Encouraging saving water in the various sectors ·
Approval of wastewater reclamation projects ·
Participation in setting water prices ·
Equalization Fund |
|
2. Ministry of Agriculture |
· River drainage and flood prevention (Drainage
Division) · Grant approval for investment in irrigation projects
(Investment Administration) · Right of veto on water prices |
|
3. Ministry of the Environment |
· Initiation and approval of all river administrations’
projects (in conjunction with the Jewish National Fund-KKL) · Authorization for irrigating with recycled wastewater
above aquifers · Authorization to dump wastewater into rivers and the
sea |
|
4. Ministry of Health |
· Purification standards for all water types and all
their uses · Authorization for irrigating
areas adjacent to wells |
|
5. Ministry of the Interior |
· Municipal Water Company
Law · National linear schemes
(TAMA-34) for water and sewage · Setting local authority water
prices (approval by the Min. of Finance) · Approval of district linear
schemes (TAMA) for development of rivers and their environs |
|
6. National Sewage Administration (Min. of
Infrastructure) |
· Approval of sewage treatment
facilities · Allocation of funding to
local authorities for sewage treatment |
|
7. Ministry of Finance (Budget Division) |
· Approval of
Mekorot water prices · Allocation of financial resources (including
subsidies} to the water economy and Mekorot · Initiation of many structural changes in the
framework of the “Arrangements Law” |
|
8. Ministry of Justice |
· Defending the
State in Supreme Court appeals, especially in precedent-setting cases
(numerous cases arise in the water economy) · Approval of
legislation drafts |
|
9. Parliamentary Finance Committee |
· Approval of water
prices (there is a strong agricultural lobby in this forum.) · Approval of
structural changes in the framework of the “Arrangements Law” and the
national budget |
|
10. Parliamentary Economic Committee |
· Established a
sub-committee on the water economy crisis. It is a parliamentary
investigative committee that is to submit recommendations |
|
11. Jewish National Fund (KKL) |
· Provides funding
for reservoirs after having been approved. Implementation usually carried
out by them · Partner in the
River Restoration Administration and in funding |
|
12. Israel Lands Administration (Ministry of
Infrastructure) |
· Allocation of land
for wastewater reservoirs and desalination plants |
Many of these bodies are divided into sub-divisions having
authorization and regulatory powers. Various branches of the same body
frequently do not adhere to a uniform policy.
The Water Supply Institutional Structure
Fresh and saline water:
63% Mekorot
(Government company, operates the national system)
8% Local authorities, private production
29% Private production for agricultural consumption, half
of it by 4 large water cooperatives (
100%
Recycled wastewater and
supply to the agricultural sector
Currently: 67% Mekorot
33% Regional cooperatives
100%
Desalination
Mekorot has rights to 50 MCM
The rest is relegated to
private producers as per the B.O.T. agreement with the government.
Water Pricing and Costs and Capacity building
potential
Water Pricing Policy
·
Water prices are uniform throughout the country, varying
only by sector and quality.
·
Prices are set by the government, based on recommendations
of the Ministry of Finance and the Water Commission, and approved by the
parliamentary finance committee.
·
These prices are for water delivered by the national
company, Mekorot, which operates
the NWC and the Shafdan and supplies some 60% of
freshwater consumption and about 50% of recycled wastewater for agriculture.
·
Private water producers set prices independently, but are
subject to an extraction levy imposed by the government. (This tax is calculated
to reflect the “scarcity price” of water.) Production and distribution of
recycled water in this sector are subject to the approval of the Water
Commission.
·
All water production requires the approval of the Water
Commission (production quotas) as does all water consumption and sale
(consumption quotas). In practice, the latter quotas apply only to the
agricultural sector and are not enforced on domestic and industrial use. (Trade
in quotas is prohibited by law.)
·
Details of water prices are presented below.
Costs
Freshwater in the national system (Mekorot)
Average cost: 0.34 US dollar per m3
Cost structure:
Capital:
40%
Energy:
28%
Work and operation: 32%
Desalination
Cost as per the latest tender for 50 MCM/year in
0.53 US dollar/m3 to the
plant’s gate.
Connection to the national system:
0.07 US dollar/m3
Transport
0.08 US dollar/m3
TOTAL
0.68 US dollar/m3
Treatment of recycled
water
Costs vary greatly according to type and size of the
facility. Larger facilities have cost advantages.
Average costs in US dollars/m3
wastewater
Secondary treatment:
0.39
Upgrade to tertiary:
0.08
Upgrade to wastewater extraction:
0.15
(desalination from 400mg to 50mg chlorine)
TOTAL cost of recycling water for broad agriculture &
ecological use 0.62
Pooling and conveyance of recycled water for agricultural
consumption:
Regional facilities (including land)
0.26 US dollar/m3
Large national facilities (Shafdan)
0.35 US dollar/m3
Consumer Prices of Water in
For consumers linked to
the national system, Mekorot
Local authorities for household use
0.345 US dollar/m3 (at “city gate”)
Industrial
0.330 US dollar/m3 (average)
Agricultural
Agricultural users of freshwater are subject to tiered
pricing and quotas. The farmers pay a reduced price for the first 50% of their
quota, a higher price for the second 30%, and the full price for the rest of the
quota. Separate rates exist for the
Water with over 400mg salinity is charged at a lower rate,
according to its salinity level.
The Shafdan
charges the same rate for summer and winter consumption, but here too there is a
quota.
Recycled wastewater is charged according to a two-tiered
system: the first 50% of the quota at a higher price and the second 50% at a
lower rate.
Agri. Water Rates by
Type Price (December 2001)
In US dollars/m3
Fresh – tier A
0.19
Fresh – tier B
0.23
Fresh – tier C
0.31 (Full use of quota averages 0.23)
Fresh – above quota
0.54
Fresh
0.13
Saline wells
0.07
Springs
0.04
Saline springs
0.014
Saline (average)
0.16
Shafdan – winter
0.15
Shafdan – summer
0.16
Shafdan – above quota
0.54
Other recycled – 1st
50%
0.14
Other recycled – remaining 0.11
User levies on private producers (water not purchased from
Mekorot).
Production (extraction) levies are imposed on all the
producers, including Mekorot, and
are intended to reflect the “shadow price”. They also pay the production and
conveyance costs.
Levies
In US dollar/m3
Coastal Aquifer
0.10
Other aquifers
0.09
Flood and saline
0.00
Water costs for domestic consumers
This is the price to the consumer as charged by the local
authorities. The maximum price is set by the Ministry of the Interior. Pricing
is progressive, based on consumption.
Rate
In US dollar/m3
consumed
Average
1.06
Sewage removal surcharge 0.49
Development plans for the Israeli water economy for the
next ten years
1. Desalination of Mediterranean seawater:
Existing decisions
250 MCM/year
Additional needs
350 MCM/year
TOTAL
600 MCM/year
Investment required: 1.4 billion dollars
2. Desalination of saline water (and saline aquifers):
Amount of water
213 MCM/year (hydrological
research is still required)
Investment required:
320 million dollars
3. Improvement of salinated wells (mainly by the municipal
authorities):
Potential water quantities
80 MCM/year
Investment required:
70 million dollars
4. Wastewater reclamation:
Current amount
280 MCM/year
Planned for end of decade – an additional
230 MCM/year
TOTAL
510 MCM/year
Investment required (estimate): 600 million dollars for
reservoirs and conveyance systems.
Upgrading wastewater for unlimited agricultural and
environmental use, including desalination:
300 MCM/year
5. Additional projects:
Fortification of the supply system along the border 600
million dollars
National filtering systems
50 million dollars
TOTAL
650 million dollars
6. Summary of the Israeli water economy’s needs for the next
ten years (estimate):
Note: Implementation limitations may require extending the
development into the next decade.
Desalination of seawater
1400 million dollars
Desalination of saline water and wells
390 million dollars
Wastewater reclamation
600 million dollars
Upgrading wastewater
600 million dollars
Additional projects
650 million dollars
TOTAL
3640 million dollars
Major Conflicts
·
Competition between the urban and the agricultural sectors
on the limited resources of freshwater. All of the inelastic domestic demand in
the steadily increasing urban sector is covered by freshwater supply, and thus a
large-scale transition in the agricultural water use from good quality water to
reclaimed urban and industrial wastewater is expected.
·
Competition between agricultural and ecological utilization
of recycled wastewater.
·
Competition between farmers in the central and in the
peripheral region of
·
Conflict between the agricultural and the urban sectors on
the purification standards for disposal set for the cities by the government.
Another conflict is on how the costs and the benefits associated with recycling
should be allocated between the generators of sewage (the municipalities) and
the agricultural users. An additional conflict is on how municipalities can be
assured that the farmers will not reduce usage suddenly (due to an economic
crisis for example) and leave the cities with treated water that they cannot
dispose of.
·
New and forthcoming partial privatization of water supply
are a potential source of conflict between the government-owned company, Mekorot, and private entrepreneurs on
two issues: the control of the supply of newly developed water resources (mostly
desalinated sea water and recycled wastewater) and the responsibility for the
operation of the intra-cities water systems (currently operated by the cities
themselves).
·
Conflicts between
Concluding statement
The agricultural sector is the major water consumer and
consequently, most of the changes will affect it. Changes are also needed in
different aspects of urban household consumption, especially due to increased
demand and the introduction of desalination of seawater.
Tel Aviv and the Arava Regions
Tel Aviv Region
Introduction
The region is located in
the coastal plain on the eastern shore of the
Domestic consumption is
similar to the national average (100 ![]() per
capita per annum). This consumption is expected to increase by 20% with the
development of metropolitan parks and the improvement in quality of life. The
quality of the fresh water is good, with a salinity level of 150-250 mg chlorine
per liter. In the future, the use of desalinated water will lead to an
improvement in the water quality. The region’s large population creates the
potential for a large supply of recycled water for agriculture. In addition,
high quality treated waste water can be used for irrigation of metropolitan
parks and for rehabilitation of streams like the
per
capita per annum). This consumption is expected to increase by 20% with the
development of metropolitan parks and the improvement in quality of life. The
quality of the fresh water is good, with a salinity level of 150-250 mg chlorine
per liter. In the future, the use of desalinated water will lead to an
improvement in the water quality. The region’s large population creates the
potential for a large supply of recycled water for agriculture. In addition,
high quality treated waste water can be used for irrigation of metropolitan
parks and for rehabilitation of streams like the
Current and New Paradigms
We start with a bullet-points description of the current
paradigm:
·
There is no private ownership of water in
·
Prices of water delivered by the national company Mekorot are set by the government, and
are determined in a procedure which is open to political pressure (skillfully
applied by the agricultural lobby). Viewing water prices not as an allocation
instrument, but as a means to improve income distribution, water charges depend
on the type of use: farmers pay the lowest prices, industry pays higher prices
and households pay the highest. Within each sector prices do not depend on
location: users in all parts of the country face the same prices, regardless of
the supply price of water. Private water suppliers are subject to quotas but can
set prices independently.
·
The actual planning of water allocation made by the Water
Commission follows several stages:
·
Predicting annual water demand by sector and region
(including, of course, that of Tel-Aviv), given the actual water prices.
o
Determination of "red lines" for each of the major water
sources and the implied total production permits of fresh water;
o
The gap between aggregate demand and total supply of fresh
water is bridged via investments in the water economy aimed at: (i) increasing the volume and
flexibility of the within-region and between-regions conveyance systems of fresh
water, (ii) development of additional (environmentally safe) water treatment
plans, reservoirs and conveyance systems; (ii) improving the quality of fresh
water as well as of the recycled effluents; and, in the longer run, (d)
desalination of sea water.
·
The current management practices result in:
o
Continuous pressure on the governmental budget to increase
the share allocated to investments in the water economy and continuous pressure
of the budget department of the Ministry of Finance to increase water prices,
including the prices for agricultural use.
The above pressure to raise prices is balanced by the
agricultural lobby which is very influential in
These detrimental effects are among the major reasons for
the current severe water crisis. Although still very influential, the
agricultural lobby lost some of its political power in the last two decades.
·
Additional conflict in the water economy exists between the
agricultural and the urban sectors regarding the purification standards for
disposal set for the cities by the government. Another conflict is over the
allocation of the costs and the benefits associated with recycling between the
generators of sewage (the municipalities) and the agricultural users. An
additional conflict is the issue of assurance for the municipalities that the
farmers will not reduce usage suddenly (due to an economic crisis for example)
and leave the cities with treated water that cannot be disposed of.
·
New and forthcoming partial privatization of water supply
is a potential source of conflict between the government-owned company, Mekorot, and private entrepreneurs on
two issues: the control of the supply of newly developed water resources (mostly
desalinated sea water and recycled wastewater) and the responsibility for the
operation of the intra-cities water systems (currently operated by the cities
themselves).
The current paradigm is the result of inefficient
institutional and administrative mechanisms for water allocation and of a poor
decision making culture (hydro-politics). The above-mentioned unsolved ongoing
conflicts partially paralyze the water economy. This is especially true in a run
of dry years (as in 1998-2001) in which many of the problems become more severe.
The main quantitative expression of the current crisis is the severe reduction
in the ability to produce freshwater from the aquifers (approximately 500MCM)
without operating additional wastewater reclamation systems and desalination
plants. The agricultural sector bears the brunt of the cuts (since the demand of
the other sectors is rigid), and its allocation was recently reduced by about
40%.
To conclude:
New Paradigm for Tel-Aviv Region
Intensifying the reclamation of wastewater for agricultural
purposes and for river rehabilitation. A large
scale transition in agricultural water use from good quality water to reclaimed
urban and industrial waste water is expected in the forthcoming years. This
shift requires the development of many more environmentally safe water treatment
plants, reservoirs and conveyance systems. The urban water economy from the
city gate to the consumers, to the treatment plant and to final disposition is
becoming as big as the economy of fresh water and it is growing
steadily. The
current trend calls for stricter adherence to water purity standards. An
inter-ministerial committee of director-generals recently issued a report
recommending substantially stricter purification standards for recycled
wastewater in the near future.
Cost-benefit analysis of the above-mentioned large-scale
transition should take into consideration:
·
The spatial distribution of aquifers and the environmental
costs associated with irrigation above them, which may pollute the underlying
groundwater.
·
The question of how the costs and the benefits associated
with recycling should be allocated between the generators of sewage (the
municipalities) and the agricultural and ecological users.
·
The question of how municipalities can be assured that the
farmers will not reduce usage suddenly (due to an economic crisis for example)
and leave the cities with treated water that they cannot dispose of.
·
At the farm level one should investigate farmers'
incentives to adapt crop varieties to water of lower quality and evaluate the
negative environmental externalities associated with sustained use of treated
wastewater.
Reform in
Water Allocation Practices - - Allocation by Prices
The goals of a reform in water pricing are to increase the
overall efficiency of water allocation to the agricultural sector, by raising
water prices to an "economically efficient" level, and at the same time to give
farmers incentives, via adequate land-dependent cultivation subsidies, to strive
towards the national goal of protecting the land and preserving the
landscape. The
efficient prices should reflect the long run costs of water supply, including
the scarcity value of water, and the environmental costs associated with water
production and/or water use. More specifically, the analysis of the reform in
water pricing should cope with the following questions:
·
How should prices vary by water quality? The quality
requirements for urban consumption are much higher than the requirements for
agricultural use, but water in Tel Aviv's region is supplied via the same
national conveyance system. Should the prices for the agricultural and the urban
sectors be identical? Should farmers pay the extra costs required to meet the
standards of urban use?
·
How should prices vary by reliability of water supply? The
supply to the urban and industrial sectors in
·
How should the spatial variation of water prices reflect
the spatially variable extraction and transportation costs? If equity
considerations imply an homogeneous price for water of a given quality, one
should evaluate the "efficiency cost" of the equity requirement. It should be
noted that an homogeneous price implies cross-subsidization among users in
different regions.
·
In addition to sending signals to water users about the
full cost of water supply, prices should also cover the costs of supply. In the
case that total revenues collected by the suppliers exceed (fall short of) the
total costs of supply, rebate to users (governmental subsidy to water producers)
should be considered.
A massive
desalination of seawater is another important action that will be taken in
The Arava
Region
Introduction
The region is located at
the south-eastern tip of
The water supply system
in the Arava is not part of the national water system. The region
receives water from local sources only, via the national water company Mekorot. Drillings in the
center of the region (Faran
drillings) yield water of reasonable quality - up to 350 mg chlorine per liter.
Drillings in the southern Arava
yield low-quality water of 600-1,100 mg chlorine per liter. It is important to
note that the Red Sea is a unique coral reserve of great ecological value, and
it is therefore essential that waste water be recycled for agriculture and not
be disposed of in the sea.
Current and New Paradigms
We start with a bullet-points description of the current
paradigm:
·
The prices for all the water supplied by Mekorot, fresh and saline, are determined within the
national framework. Saline water is cheaper than fresh water, in accordance with
the salinity level. The price for recycled water for agriculture covers the
operational and the capital costs of Mekorot, after discounting state grants.
·
The desalination plant of
·
The utilization of recycled waste water produced in Eilat for irrigation is insufficient
and inefficient, due to lack of adequate storage facilities and conveyance
systems as well as poor institutional structure. The potential to recycle
wastewater produced in the rural villages is not utilized as well.
New Paradigm for the Arava Region
The general principle is
to introduce regional administration of the water sector, with institutional and
economic separation of the Arava
water resources from the national water system. The water development plans for
the region are mainly for pooling and transferring waste water.
The details of this principle are threefold:
·
All water supplied to the city of
·
Wastewater “produced” by the city of
·
Water prices for agriculture will be determined
independently of the national system so as to reflect the specific cost of their
production. Prices of recycled wastewater will be determined by negotiation
between the city of
It should be noted that
the Arava region borders with
A Brief Summary of Relevant Data for the Selected Regions
Some of the relevant data required for our analysis are
summarized in the tables below. The data in all tables refer to the year 2000.
Population
Distribution of population by type of settlement
|
Type of Settlement |
Tel - Aviv |
Arava | ||
|
|
thousands |
% |
thousands |
% |
|
Metropolitan areas (Pop. exceeding 200,000) |
359 |
18 |
- |
0 |
|
Big cities (Pop. 100,000-200,000) |
902 |
47 |
- |
0 |
|
Mid-sized cities (Pop. 20,000-100,000) |
485 |
25 |
41 |
87 |
|
Small towns and cities (Pop. 2,000-20,000) |
149 |
8 |
- |
0 |
|
Villages and communities |
42 |
2 |
5 |
13 |
|
TOTAL |
1,937 |
100 |
46 |
100 |
The Arava region is sparsely populated, based mainly on the
tourist city of
Domestic, Industrial, Agricultural
and Environmental Water Consumption
Domestic Consumption (MCM/year)
|
Year |
m3 / capita |
Consumption from National System |
Consumption from Local System |
Total Demand |
|
Tel - Aviv |
100 |
75 |
119 |
194 |
|
Arava |
200 |
0 |
9 |
9 |
Industrial Consumption (MCM/year)
|
Year |
Freshwater |
Saline Water |
Recycled Water |
Total | ||
|
|
Consumption from National System |
Consumption from Local System |
Total Demand |
|
|
|
|
Tel - Aviv |
23 |
35 |
58 |
0 |
0 |
58 |
|
Arava |
0 |
1 |
1 |
0 |
0 |
1 |
Agricultural Consumption (MCM/year) Sources:
|
|
|
Tel - Aviv |
Arava |
|
National System |
Fresh |
33 |
- |
|
|
Recycled |
5 |
- |
|
|
Saline |
- |
- |
|
|
Total |
38 |
- |
|
Local System |
Fresh |
51 |
15 |
|
|
Recycled |
- |
5 |
|
|
Saline |
- |
14 |
|
|
Total |
51 |
34 |
|
TOTAL |
Fresh |
84 |
15 |
|
|
Recycled |
5 |
5 |
|
|
Saline |
- |
14 |
|
|
TOTAL |
89 |
34 |
Environmental Consumption (MCM/year) Sources:
|
|
|
Tel - Aviv |
Arava |
|
Local System |
Fresh |
- |
- |
|
|
Recycled |
2 |
- |
|
|
Saline |
- |
- |
|
|
Total |
2 |
- |
The Tel-Aviv region is
characterized by relatively high domestic and industrial consumption, and
relatively low agricultural consumption. The opposite is true with respect to
the Arava Region. The large
population of Tel-Aviv region creates the potential for a large supply of
recycled water for agriculture. In addition, high quality treated waste water
can be used for irrigation of metropolitan parks and for rehabilitation of
streams like the
Water Supply and General water Balances; Salinity Level of
Water Resources
General Water Balance (MCM/year)
|
|
Tel - Aviv |
Arava |
|
Demand by sector: |
|
|
|
Domestic |
188 |
9 |
|
Industrial |
58 |
1 |
|
Agricultural |
90 |
34 |
|
Jordan & PA |
- |
- |
|
Environment |
2 |
- |
|
Total |
338 |
44 |
|
|
|
|
|
Demand by water type: |
|
|
|
Freshwater |
331 |
25 |
|
Reclaimed |
7 |
5 |
|
Saline |
- |
14 |
|
Total |
338 |
44 |
|
|
|
|
|
Supply: |
|
|
|
Aquifers (including saline) |
333 |
30 |
|
Desalination |
- |
9 |
|
Recycled |
5 |
5 |
|
Total |
338 |
44 |
Salinity Levels and Long-Term Average Recharge by Water
Resource
|
Basin |
Salinity Level (mgchlorine/liter) |
Average Annual-Recharge (MCM) |
|
Coastal Aquifer – National System and Local
Producers |
- |
250 |
|
|
- |
180 |
|
Arava – Local Sources |
400 |
- |
|
TOTAL |
400 |
214 |
Natural water
sources in the Tel-Aviv region are:
1.
Supply from the national water system (via the national
water network of the Mekorot
company):
a.
Production from the coastal aquifer, above which the region
lies
b.
Water supply from the
2.
In addition, part of the fresh-water is provided by private
producers from the coastal aquifer (some 35% of the fresh water).
3.
In the future, this region is slated to receive a
significant amount of the desalinated sea water. Domestic consumption is similar
to the national average (100 m3 per capita per annum). This consumption is
expected to increase by 20% with the development of metropolitan parks and the
improvement in quality of life.
The quality of the fresh
water is good, with a salinity level of 150-250 mg chlorine per liter. In the
future, the use of desalinated water will lead to an improvement in the water
quality.
The Arava is not part of the national water system, but
receives water from local sources only, via the national water company Mekorot:
Drillings in the center
of the region (Faran drillings)
yield water of reasonable quality: up to 350 mg chlorine per liter.
Drillings in the
southern Arava yield low-quality
water: 600-1,100 mg chlorine per liter. The desalination plant of
In addition, waste water
for agriculture is obtained from Eilat and the agricultural settlements. It is
important to note that the Red Sea is a unique coral reserve of great ecological
value, and it is therefore essential that waste water be recycled for
agriculture and not be disposed of in the sea.
The water development
plans for the region are mainly in the area of pooling and transferring waste
water. In the more distant future there is a possibility that the desalination
plant in Eilat will be
enlarged.
Summary Matrix and Map
This section is summarized via a detailed summary matrix
and a map in which the borders of the two selected regions are outlined.
Summary Matrix of Israeli Regions
|
|
|
|
Tel
- Aviv |
Arava |
|
Natural conditions and infrastructure |
Regional Context |
Climate Type |
Semiarid |
Hyperarid |
|
Aridity Index |
0.05-0.2 |
0.5-0.65 | ||
|
Permanent Population |
1,937,000 |
46,200 | ||
|
Water availability |
Total Water Resources / Availability (MCM) |
343 |
44 | |
|
Trans-boundary water |
|
| ||
|
Water quality |
Quality of surface water |
- |
- | |
|
Quality of groundwater |
Good |
Poor | ||
|
Quality of coastal water |
- |
- | ||
|
Water Supply |
Percentage of supply coming from: v Groundwater v Surface water v Desalination v Recycling v Importing |
99% 0% 0% 1% 0% |
68% 0% 21% 11% 0% | |
|
Network coverage: v Domestic v Irrigation v Sewerage |
100% 100% 100% |
100% 100% 100% | ||
|
Economic and Social System |
Water use |
Water consumption by category: v Domestic v Irrigation v Industrial and energy production |
56% 17% 27% |
21% 77% 2% |
|
Population to resources index |
|
| ||
|
Water demand |
Water Demand trends v Domestic v Industrial v Agriculture v Rivers |
Steadily increasing Steadily increasing Transfer to recycled
water Use of recycled
water |
Stable Stable Transfer to recycled
water - | |
|
Consumption index |
Stable per-capita urban consumption |
Stable per-capita urban consumption | ||
|
Exploitation index |
100% |
100% | ||
|
Pricing system |
Average household budget for domestic water (pa)
|
$100 |
$130 | |
|
Average household budget for agricultural water
|
|
| ||
|
Average household income |
|
| ||
|
Cost recovery |
|
| ||
|
Price elasticity |
Agricultural demand is somewhat elastic. Elasticity
of urban and industrial demands are small. |
Agricultural demand is somewhat elastic. Elasticity
of urban and industrial demands are small. | ||
|
Social capacity building |
Public participation in decisions |
Very High |
Very High | |
|
Public education on water conservation
issues |
Fair |
Fair | ||
|
Decision Making Process |
Water Resources Management |
Water ownership |
State |
State |
|
Decision making level (municipal, regional, national)
regarding: v Water supply for each sector v Water resources allocation for each sector |
National National National |
National Local Local | ||
|
Water Policy |
Local economy basis |
National |
National | |
Development priorities |
Recycling and Desalination |
Recycling and Desalination |
