Cyprus
Abstract
Nonetheless,
Due to climatologic conditions and development,
New legislation for the protection of water and a new
proposed law for water resources management under one Entity together with the
implementation of the EU Water Framework directive give a new impetus to the
local efforts for water management.
In the text that follows an overview of the existing
water conditions and circumstances for the whole country is presented. Finally
and after analysing all major hydrologic regions, and on the basis of specific
indices, three regions are selected as representative of water deficient
regions, either due to climatologic reasons, complicated circumstances,
increased demand or inappropriate and inefficient water resources management.
These are the Akrotiri aquifer area, the Germasogeia river water system and the Kokkinochoria
area. The range of circumstances in these three regions is analysed, and
presented in table form.
Introduction
The
Although
a large number of various water supply investments and interventions have been
made such as surface water dams, groundwater exploitation, interbasin
water transfers, desalination and reuse of tertiary treated effluent,
Currently
and after a long sequence of relatively dry years all the aquifers have been
exploited far beyond their safe yield with the result of most of the coastal
aquifers being sea intruded to extents of up to 2 kilometers, the yield of the
wells has dropped considerably and strategic reserves have been totally
depleted.
Most
of the economic sites for surface water dams have been used up and additional
reservoirs have prohibitively high costs to develop.
Irrigation
efficiencies are quite high being in the range of 75% or higher and thus no
serious additional saving can be expected.
Presently
Currently,
Drought sequences may cause water shortage problems anywhere
in the island but certain areas face long term water shortage mainly due to
lack of water availability or increased demand or even due to ineffective
management practice. In the report that follows a general overview of the
island’s water resources and demand is given followed by a brief description of
three selected areas, the Akrotiri, the Germasogeia and the Kokkinochoria
where water scarcity, overexploitation and management problems are evident.
Table
1: Summary of
|
Background |
Description |
|
Climate |
The
central Troodos massif, rising to 1951 metres a.m.s.l., and to a less
extent the long narrow Kyrenia mountain range, with
peaks of about 1000 metres a.m.s.l.,
play an important part in the meteorology of Cyprus. The predominantly clear
skies and high sunshine amounts give large seasonal and daily differences
between temperatures of the sea and the interior of the island that also cause considerable local effects especially near the
coasts. In
summer the island is mainly under the influence of a shallow trough of low
pressure extending from the great continental depression centred
over southwest In
winter The
average precipitation for the year as a whole is about 500 mm but it was as
low as 182 mm in 1972/73 and as high as 759 mm in 1968/69. The average
precipitation refers to the island as a whole and covers the period
1961-1990. Statistical analysis of precipitation in |
|
Geomorphology |
Two mountain
ranges run east to west. The Troodos mountains
cover approximately 3 500 km2 in the west and rise to
nearly 2 000 m. The Kyrenia mountain
range along the northern coast covers 400 km2 and rises to
950 m. In between these two mountain ranges lies the central plain of Mesaoria covering 2 500 km2. The
remaining land forms narrow coastal plains, which are good for agriculture.
There are no perennial streams. Most of the winter streams traversing these
plains originate in the |
|
Geology |
There
are four major geologic belts that are roughly parallel to each other in an
east - west direction. In a south-westward sequence these are: 1.
The Kyrenia mountain range consisting mainly of
limestone enveloped on either side by chalks and flysch
deposits. The limestone constitutes the major aquifer in this belt. This Range is markedly elongate, narrow and
runs slightly inland of and parallel to the north coast. 2.
The broad Mesaoria Plain, which separates the Kyrenia from the 3.
The Troodos Igneous Massif the central part of
which is occupied by plutonic rocks. A sheeted intrusive complex constitutes
the largest portion of the range and surrounds or occasionally intrudes the
plutonic rocks. To these rocks, the Troodos Pillow
Lava Series form a rough girdle. The Troodos massif
has the shape of a rather squashed oval, eighty kilometers long, about thirty
kilometers wide. It receives most of the available rainfall. The nature of
its constituent rocks precludes deep percolation except along fracture zones,
hence there is considerable runoff and its drainage includes the largest of 4.
Calcareous sediments that overlap onto the igneous rocks of the massif form the
foothills to the south and west. Within those, in the western part of the
island are outcrops of the highly contorted and predominant shaly rocks of the Mamonia
complex that form an aquiclude. Within the
calcareous sediments, the Middle Miocene contains aquiferous
sediments, conglomerates and gypsum deposits. Along
the coast and forming a distinct but discontinuous coastal plain, are rocks
of the Plio-Pleistocene that although dominantly marly, they include lenses of coarser material forming
aquifers that are of importance. Extensive
river gravel deposits that form good and readily exploitable aquifers in fill
the V-shaped valleys cut by the rivers, beyond the steep gradients of the
mountain areas. |
|
Land
use |
Some
60 per cent of the |
|
Aridity
Index |
a)
The high altitude areas (500 to 1950 m. amsl) of
the Troodos mountain range that dominates the
central part of the island (18% of the island). The mean annual precipitation
is 690 mm varying from 400 to 700 mm at elevations of 500m to 1100 mm at the
peak of the mountain. The mean annual evaporation varies from 1400 to 1700 mm
at 500 m elevation to 1000 mm at the top. This area may be assigned an
overall aridity index of 0.54 classifying it as “Dry sub-humid”. b)
The slopes of the Troodos mountain Range at
altitudes of 200 to 500 m. amsl (27% of the island)
with a mean rainfall of 300 to 500 mm at the lower elevation and 400 to 700
mm at the higher elevations, the rainfall being higher at the western and
southern slopes rather than at the northern and eastern slopes. The annual
evaporation varies similarly from 1600 to 1900 mm at lower elevations to 1400
and 1700 mm at the higher ones. This area may be assigned an overall aridity
index of 0.3 classifying it as “Semi-arid”. c)
The Mesaoria Plain dominating the central eastern
part of the island (20% of the island) at elevations of 0 to 200 m. amsl with an annual rainfall in the range of 290 to 350
mm and an evaporation of 1650 to 1850 mm. The area may be classified as
“Arid” with an aridity index of 0.18, and d)
The coastal areas at 0 to 200 m elevation amsl, but
including the Pentadactylos mountain range along
the northern part of the island (35% of the island). The mean annual rainfall
varies between 350 and 400 mm in the south-eastern and southern areas and 450
to 500 mm in the western and northern areas. The mean annual evaporation is
in the range of 1700 to 2000 mm. Using the same Penmann-Monteith
classification these areas may be termed as “Semi-arid” with an aridity index
of 0.23. Thus,
the overall average aridity index is 0.295 classifying the climate of the
whole island as Semi-arid. |
|
Permanent
Population |
The present permanent population (based on the
1992 census and the population growth rate provided by the Department of
Statistics –0.9% for the urban areas and 0.6% for the rural areas) within the
government-controlled areas of Cyprus is 673 000 of which 74% lives in the
main cities and suburbs and 26% in the rural areas. Although definite figures
are not available for the Turkish Cypriots in the occupied part of the
island, it is believed that at present they amount to some 88 000 after some
55 000 have left the island. The recorded tourist arrivals in |
Fig. 1: Mean annual precipitation in mm over the
period of 1971 to 2000

Fig. 2 : Mean
annual Class A Pan evaporation in mm in 1991 to 2000

Overview of the country
Water
Demand and Supply Status
The Total Annual Water Demand for the
government-controlled part of
|
AGRICULTURE |
|
|
182.5 MCM |
|
69% |
|
DOMESTIC |
|
|
67.5 MCM |
|
25% |
|
Inhabitants |
53.4 MCM |
79% of Domestic |
|
20% |
|
|
Tourism |
14.1 MCM |
21% of Domestic |
|
5% |
|
|
Total domestic |
67.5 MCM |
100% |
|
25% |
|
|
INDUSTRY |
|
|
3.5 MCM |
|
1% |
|
ENVIRONMENT |
|
|
12.5 MCM |
|
5% |
|
TOTAL WATER
DEMAND |
|
|
266 MCM |
|
100% |
The projected annual water demand in
million m3 for the years 2005, 2010 and 2020 is as follows (The
estimates being based on: 215 litres/capita/day for main
towns, 180 litres/capita/day for villages and 465 litres/capita/day for
tourist demand):
|
Sector of Demand / Year |
2000 |
2005 |
2010 |
2020 |
|
Agriculture |
182.4 |
182.4 |
182.4 |
182.4 |
|
Domestic |
|
|
|
|
|
Inhabitants |
53.4 |
58.4 |
63.2 |
73.5 |
|
Tourism |
14.1 |
18.0 |
22.9 |
30.8 |
|
Industry |
3.5 |
5.0 |
6.0 |
7.0 |
|
Environment |
12.5 |
14.0 |
16.0 |
20.0 |
|
TOTAL (Mm3/a) |
265.9 |
277.8 |
290.5 |
313.7 |
Agriculture, being
the major water-consuming sector about 70%, contributes little on the GDP. On
the other hand, tourism consuming about 6% of the total water demand of all
sectors, contributes by over 20% on the GDP.
The
recent consecutive dry years, have affected all the sectors of water use,
particular the agriculture and domestic. During the year 2000, the average
water shortage was 37.6% in agriculture and 23.4% in domestic. Such situation
has led the Government to look for alternative sources of supply
(desalination), at least for domestic purposes.
Water Availability
|
Total Water resources/Availability |
The island-wide water balance based on the average
rainfall of the 1951- 1980 thirty-year period of 477 mm, and which is 95%
of the long-term average of 500 mm, is presented here below. This period is
chosen since this is the last for which rainfall data are available for the
whole island, the northern part of the island being inaccessible after 1974. The average annual water crop for this period
amounts to 780 Mm3. Some 65 percent, or 510 Mm3, of the
total annual water crop appears as surface runoff. Of the total surface
runoff only 45 percent, or 230 Mm3, (29 percent of the
total water crop) is lost to the sea. This indicates the high level of
surface runoff utilization and control achieved in Some 27 percent, or 140 Mm3,
infiltrates into riverbed aquifers and coastal alluvial fans. Part of this
water is drawn through wells and boreholes, and the remainder goes to the
sea. 8 percent, or 40 Mm3, of surface runoff is
used diverted for spate irrigation in late winter or early spring, and
especially during wet seasons. A large quantity of the surface runoff is
captured in surface reservoirs, which provide inter-annual storage. Thus,
these reservoirs generally are able to hold two to three times the average
annual flow of a stream. The island’s total surface reservoir capacity is 300
Mm3. Current use of stored water for irrigation and domestic
supply is about 20 percent or 100 Mm3. Excluding surface runoff the remainder of the annual
water crop, or 270 Mm3, is assumed to directly replenish the
island’s aquifers. Added to the direct recharge of 270 Mm3, is
surface runoff recharge of 140 Mm3, amounting to a total recharge
of 410 Mm3 annually. Of the total annual replenishment 54 percent,
or 220 Mm3, is pumped for irrigation and domestic uses, with the
remaining 56 percent, or 230 Mm3, going to the sea. Where
pumping exceeds recharge, a deficit of 10 percent, or 40 Mm3,
is created in certain aquifers. The result of long-term over-pumping has been
sea-intrusion in certain major coastal aquifers. Subsurface losses to the sea derive from minor
aquifers during early spring when water is not needed for irrigation and from
river delta deposits during winter. The major aquifers also lose a small
proportion that is needed to control sea intrusion. Thus, it appears that |
|
The Average Annual Water Crop |
For the period of 1951 to 1980 the average annual
total water crop has been calculated on the basis of the catchment
areas, the respective average annual rainfall and the corresponding
percentage of net rainfall. For this period the Total Water Crop for the
island amounts to 781 Mm3. A recent study by FAO and the WDD for 31
watersheds and using the observed flows of the period of 1971 to 2000 shows a
reduction by as much as 58% of the estimates based on the period of 1951 to
1980. This is attributed mainly to the reduction of rainfall over the same
period compared to the periods before 1970. The mean annual precipitation of
this period is 100mm or more lower than the mean of the older period at
almost every location of elevation higher than 500 m |
|
The Surface Runoff |
The surface runoff refers
to the water flowing at the surface either appearing in
streams and used either for spate irrigation, or stored in surface
reservoirs and subsequently used, or recharging riverbed alluvial aquifers or
alluvial fans on the coast and finally part of it being discharged to the
sea. Overland flow that appears during storms and most of which is lost to
the sea is also included under the same term. The Table below shows the
surface runoff for each Hydrologic Region together with the allocation to
various uses and amounts going to recharge or discharging to the sea. Of the total surface water resources only some 35 %
are lost to the sea, which indicates the high utilization and control on
surface runoff that has been achieved in the island through the water
development schemes that have been put into operation in the last 35 years.
This is more important if one considers that a large proportion of the losses
to the sea contain overland flow and flow from minor streams which do not
offer good opportunity for control. Some 28 % is estimated to infiltrate the riverbed
aquifers and the coastal alluvial fans, part of which is pumped through wells
and boreholes and part finds its way to the sea through the subsurface. Some 7 % is used directly from the surface runoff by
diversions for spate irrigation in late winter or early spring, especially
during wet seasons. A large quantity of the surface runoff is captured
in surface reservoirs, most of which have a capacity two to three times
larger than the average annual flow of a stream to provide inter-annual
storage. The total surface reservoir capacity in the island is 300 Mm3. The
quoted use of surface water from dams for irrigation and domestic supply
refers to the rated yield of each reservoir. The total use of water from
reservoirs, or from diversions to reservoirs, in an average year, is of the
order of 30 %. |
|
The Groundwater resources |
The balance of the annual Total
Water Crop less the Surface Water
Resources is assumed
to replenish directly the aquiferous systems in the
island some of which constitute the major aquifers and some are of lesser
importance due to their small yield and extent.
To this
direct recharge, the recharge from surface runoff is added to provide the
total annual ground water replenishment that is considered as the safe yield
of the aquifers. The Table below lists, by Region, the estimated
ground water replenishment due to surface runoff and direct from rainfall as
well as the allocation of the ground water resources to usage and subsurface
losses to the sea. The amounts of annual over-pumping are also indicated. Of the annual total Ground
Water replenishment of 415 Mm3 some 66 % are due to direct recharge from
rainfall and 34 % from the surface runoff. Of the total annual replenishment,
some 58 % is pumped and used for irrigation and domestic water supply and
some 55 % finds its way to the sea through the subsurface. This creates a
deficit in certain aquifers where pumping exceeds the replenishment of a
total of 13 %. |
|
Transboundary
Water |
There
is no trans-boundary water flow in the island except along the artificial
boundary created between the “occupied” and the government controlled part of
the island. This does not involve more than 10% of the total water resources.
|
|
Region |
Catchment |
Average |
Surface |
Surface
Water Use (Mm3) |
||||
|
No |
Name |
Area
(km2) |
Rainfall (mm) |
Runoff
(Mm3) |
Spate
Irrig. |
from
Dams |
to
Recharge |
Runoff
to sea |
|
1 |
PAFOS |
1188 |
627 |
125 |
9 |
47 |
20 |
48 |
|
2 |
TYLLIRIA |
745 |
585 |
59 |
2 |
10 |
7 |
39 |
|
3 |
MORFOU |
1585 |
429 |
96 |
7 |
6 |
42 |
41 |
|
4 |
KYRENIA |
455 |
490 |
16 |
0 |
0 |
9 |
7 |
|
5 |
KARPASIA |
685 |
463 |
22 |
0 |
0 |
3 |
19 |
|
6 |
MESAORIA |
1840 |
381 |
53 |
4 |
6 |
41 |
2 |
|
7 |
S.E. MESAORIA |
546 |
341 |
4 |
0 |
1 |
0 |
3 |
|
8 |
LARNAKA |
1050 |
439 |
39 |
4 |
18 |
10 |
7 |
|
9 |
LIMASSOL |
1155 |
555 |
96 |
11 |
64 |
9 |
12 |
|
Total |
9249 |
|
508 |
37 |
152 |
141 |
178 |
|
|
Island-wide average |
|
478 |
|
|
|
|
|
|
|
Region |
Ground Water Recharge (Mm3) |
Use
by (Mm3) |
Deficit |
||||
|
No. |
Name |
Streams |
Direct |
Total |
Pumping |
to
Sea |
|
|
1 |
Pafos |
20 |
46 |
66 |
18 |
47 |
0 |
|
2 |
Tylliria |
7 |
23 |
30 |
11 |
20 |
0 |
|
3 |
Morfou |
42 |
30 |
72 |
89 |
11 |
29 |
|
4 |
Kyrenia |
9 |
19 |
28 |
11 |
17 |
0 |
|
5 |
Karpasia |
3 |
26 |
29 |
2 |
27 |
0 |
|
6 |
Mesaoria |
41 |
47 |
88 |
28 |
60 |
0 |
|
7 |
S.E. Mesaoria |
0 |
11 |
11 |
35 |
1 |
25 |
|
8 |
Larnaka |
10 |
34 |
44 |
14 |
31 |
0 |
|
9 |
Limassol |
9 |
37 |
47 |
35 |
15 |
3 |
|
Total |
141 |
273 |
415 |
243 |
229 |
57 |
|
Water Quality
|
Quality of surface water |
Water
quality is generally good for domestic and irrigation uses. However,
insecticide residues and high nitrate concentrations have recently been
observed in dams, especially where there is intensive agriculture in the
upstream parts of the watersheds. |
|
Quality of groundwater |
Groundwater
quality is generally good for domestic and irrigation uses. However, a rising
trend of insecticide residues and high nitrate concentrations has been
observed in the last few years in groundwater, especially where there is
intensive agriculture and where the natural replenishment from surface
streams has been cut off by surface reservoirs. In the same areas increased
irrigation with available surface water has increased fertilizer leaching and
insecticide input to the groundwater. |
|
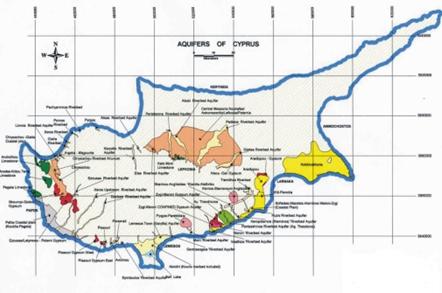
Quality of coastal water |
Water
salinity is also increasing in coastal areas due to sea intrusion in aquifers
caused by over-pumping. All the major aquifers in the island exhibit seawater
intrusion of various extents. In at least three of them the inland
propagation is of the order of 2 km rendering the most productive part
useless. |
Fig 3. The aquifers of
Water Supply
The annual
water demand for the government controlled part of the island is evaluated to
be 266 million cubic meters of which 195 million cubic meters or 73% are for
irrigation and 71 million cubic meters or 27% are for the domestic supply.
Presently the contribution of the various water sources to the overall demand
for all sectors is as follows:
- Groundwater 48%
- Surface water 38%
- Desalination 13%
- Springs 1%
The use of
treated sewage effluent is limited at present, amounting to 1% of the agricultural
demand.
Percentage of
supply coming from:
|
Groundwater |
The
annual groundwater extraction is estimated to be 127 million cubic
meters or 48% of the total supply. Of this quantity about 100 million cubic
meters are used for agriculture, 16 for domestic supply, 3.5 for industry and
7.5 million cubic meters for the environment. Water from springs mounting to
3.5 million cubic meters per year is used for the domestic water supply
mainly of villages in the mountainous part of the island. It
should be noted that the quoted groundwater extraction is in most areas
exceeding the safe yield of the aquifers. As a result of this the original
yield of the wells in many areas has diminished whilst elsewhere sea
intrusion has been observed extending occasionally up to 2 or more kilometers
inland. |
|
Surface water |
The
average annual yield of the 274 million cubic meter capacity main surface
reservoirs is about 101 million cubic meters or 38% of the total supply. Of
this yield some 82 million cubic meters are used for irrigation, 14.5 million
cubic meters for domestic supply and 4.5 are used for ecological purposes. This
does not include use of surface water for the spate irrigation of cereals,
olive and almond trees in early spring on the occasion of flow availability. |
|
Desalination |
Two
Desalination Plants using seawater and the reverse osmosis method provide an
annual supply of 30 million cubic meters for domestic purposes. The two
plants with their nominal capacity are at Dhekelia
(40000m3/d) and at Larnaka airport (52000 m3/d). Plans are under way for another
plant at Limassol with a capacity of 20000 m3/d
to start operation by 2004 and with a possible extension of capacity to 40000
m3/d. |
|
Re-use of tertiary treated
effluent |
Two sewage schemes at Limassol
(since 1995) and Larnaka (since 1997) provide
annually, at present, some 4 million cubic meters of tertiary treated
effluent for the irrigation of fodder, trees and parks. Sewage
treatment plants are now under design or construction in all the major cities
and sensitive mountain villages, especially those of equivalent population of
2000 or more, of The
following figures and pie charts (Savvides, FAO
Project 2002) illustrate the allocation of demand and source of supply, by
sector. |
The permanent
crops consume 59% of the total agricultural irrigation water demand, whereas
vegetables consume 41%.
In years of low
rainfall and limited water supply the vegetable area is reduced and priority of
water demand satisfaction is given to the permanent crops.
The 67.5 Million m3
of Domestic Water Demand (inhabitants and tourism) is distributed as follows:
Ø
Main
cities and suburbs: 78%
Ø
Villages
and British Bases 22%
The contribution of each source to the total domestic
demand is as follows:
Ø
75% of
the total domestic water demand is covered by the Treatment Plants and
Desalination Units
Ø
20% is
covered from groundwater through boreholes
Ø
5% is
covered by springs
Water Storage features
Since 1960, attention was turned to the systematic
study and construction of water development works, both for storage and
recharge purposes. After a comprehensive survey of the island’s water resources
a long-term plan for the construction of major development projects was
followed, which involved the construction of a large number of dams. The
current total storage capacity of surface reservoirs has reached 307,5 Mm3
of water from a mere 6 Mm3 in 1960, and will reach 325.5 by 2004
with the completion of the Kannaviou dam, a truly
impressive achievement when compared to other countries of the same size and
level of development as Cyprus. In Cyprus there are today 106 dams and ponds:
35 large dams with a capacity of 286,1 Mm3 of water of which 4 are
recharging-flood protection dams, 42 small dams with a capacity of 16,1 Mm3
of which 32 are recharging-flood protection dams, and 26 ponds with a capacity
of 2,5 Mm3. Eighty-one
(81%) of the dams, i.e., 85 in number are earth fill or rock fill dams and the
remaining 19% i.e., 20 in number are concrete dams.
Problems:
Water Shortage
During the dry years 1997 – 2000 there was
a severe shortage in the supply of water to all sectors, due to consecutive low
rainfall. The available water in the major dams had reached critical low levels
and priority was given for the domestic needs. In all sectors the water was
rationalized and the shortage was (Savvides, FAO,
2002):
Ø
23.4%
in the domestic sector
Ø
37.6%
in the agricultural sector (average)
Ø
45.6%
within the Government projects
Ø
20%
for Agriculture outside Government Irrigation Schemes (assumed)
Due to the limited availability of water
resources, priority was given to cover the domestic needs and in agriculture
priority to permanent crops, covering only portion of their water demand.
The water
allocated to farmers was in the range of 30% to 70% of the normal demand,
depending on the type of crop and the availability of water in each project. In
some projects the vegetable area was significantly reduced, in order to save
water and cover part of the needs of the permanent crops.
Environmental
issues
Water protection is highly ranked in
National water policy focuses on the provision of
adequate supplies of water for drinking and residential use, including the
tourism and the industry sectors, as well as for the development of
agriculture. In drought seasons, priority is given to the supply of drinking
water, with restrictions in the supply of water for irrigation purposes.
The protection of waters from pollution is based on
the legislation (Law for Water Pollution Control), which was introduced in 1991
as part of the broader environmental legislation of the island.
The recently introduced legislation for the protection of
water, in line with the European Legislation, introduces for all water
resources the general requirement for ecological protection aiming at “good
ecological status”.
Urban waste water
An adequate number of central sewage systems exist covering
the urban areas of the island.
Moreover a number of central sewerage systems
have been constructed covering some of the rural areas, whilst there is under
implementation a big program for the collection and treatment of rural
wastewaters covering the whole island.
The high quality treated effluents of the central
treatment plants are utilized for irrigation and for aquifer recharging, under
the provisions of a Code of Contact for Good Agricultural Practices and of
Quality Standards for the re-use of treated effluent.
Groundwater
The Water
Pollution Control Law (and a Decree issued under this law) regulates the
quality of groundwater. A list of substances has been legislated whose direct
and indirect discharge into groundwater is prohibited. Groundwater quality is
monitored on a regular basis including the preparation of hydrochemical
charts.
Groundwater
quality is generally good for domestic and irrigation uses. However,
insecticide residues and high nitrate concentrations have recently been
observed in groundwater, especially where there is intensive agriculture and
where the natural replenishment from surface streams has been cut off by
surface reservoirs. In the same areas increased irrigation with available
surface water has increased fertilizer leaching and insecticide input to the
groundwater. On-going farmer training programmes, phytosanitary controls, and chemical analysis programmes for pesticides residues, etc. are the actions
adopted to control the use of fertilizers and plant protection products.
Surface waters
Two are the problems of concern related to the surface
waters environmental conditions: the discharges of dangerous substances, and
nitrate pollution from agricultural sources.
Discharges of dangerous substances
The discharges of dangerous substances into
surface waters are regulated by a Decree issued in 1993, which prohibits the
direct discharges, and makes indirect discharges subject to a permit based on
criteria such as effluent characteristics (quality standards, quantity),
disposal characteristics (place and method of disposal), monitoring
specifications, etc.
Two central industrial effluent and domestic septage treatment plants are in operation, one in
Nitrate pollution from agricultural sources
Water
quality is generally good for domestic and irrigation uses. However,
insecticide residues and high nitrate concentrations have recently been
observed in dams, especially where there is intensive agriculture in the
upstream parts of the watersheds.
A monitoring programme
of the quality of waters in reservoirs (covering 226 chemical, microbiological
and toxicological parameters) was completed in 2000. There is also in place a
monitoring programme for surface waters (and
groundwater) near the industrial areas of the island.
The
provisions of the Code of Good Agricultural Practice are applied through the
island, i.e. control of fertilizer use, use of improved irrigation systems and
preparation of irrigation schedules, relocation (wherever is possible) of
animal husbandry units, slurry collection, mechanical separation and land
application of piggery waste, on-going farmer training programmes,
etc.
Water
laws and Regulations
There is currently no umbrella law covering
water, however, all surface water, groundwater and wastewater belongs to the government, which has the power to construct
waterworks and undertake their management. Legislation on water has evolved on
an ad hoc basis. The result is that present
statutory water laws are numerous, complex, duplicatory,
with divided authority and recognition of private rights. Primary
responsibility for enforcing these laws is divided between the two Ministries
of Agriculture and the Interior. There are seven important water laws in force
as well as another 15 that include provisions related to water.
These laws form the basis of resource development,
interaction between the government and users, and establishment of local water
bodies. The legislation covering groundwater abstraction is particularly
deficient in light of significant degradation of several aquifers. Private
individuals have the right to apply for permits to sink boreholes or dig wells.
Several surface and groundwater sources may constitute private property in the
form of registered water rights. Still the government has the power to declare
some groundwater aquifers to be under “Special Measures” and impose
restrictions on borehole drilling and water abstraction.
Illegal drilling of wells has been quite common and in
one particular area up to 47 percent of the wells was drilled without a permit.
The responsibility for monitoring compliance and dealing with illegal well
drilling lies with the District Officer of the Ministry of Interior. In
practice, monitoring of compliance is also executed by the WDD who must refer
such cases to the DO to take action and bring to court such illegal actions.
Illegal drilling occurs mainly because farmers need to
improve their economic situation. Illegal drilling not only continued but
increased because of the limited supervision and control, the light penalties
imposed, the possibility of each case being reconsidered, the issuing of a
covering permit after discovery and interference in the process by
non-technical lobbies. Added to this, the leniency in the case of farmers based
on their social and economic situation plays an important role.
The protection of the environment and of the water
quality has been encoded in the Control of Water Pollution Law 69 of 1991. This
law provides for the elimination or reduction and control of water pollution,
for the improved protection of water resources, the health of the population
and the protection and improvement of the environment and water’s flora and
fauna.
Institutional
framework and constraints
The Chart below shows the structure of the water management institutions. The Council of Ministers is responsible for water policy and which is formed jointly by four ministries - Agriculture, Finance, Interior and Commerce. Executive power is divided between the Ministry of Agriculture, Natural resources and Environment (MANR&E) and the Ministry of Interior. MANR&E has technical responsibility for water resources policy, assessment and monitoring, but also for development and bulk selling water to end-users. The Ministry of Interior is responsible for enforcing water-related laws that include issuing groundwater permits. Its representatives act as the chairmen of municipal water boards, village water commissions and local irrigation associations, known as Irrigation Divisions (ID).
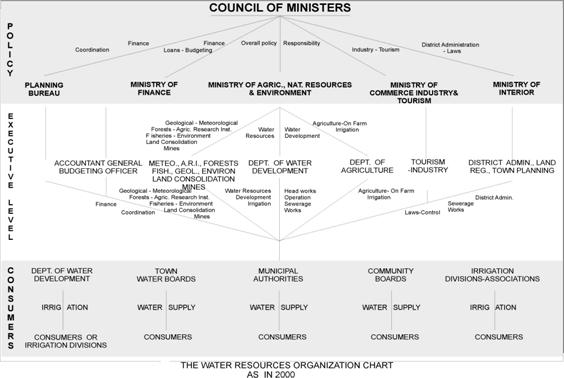
The Water
Development Department (WDD) is responsible for implementing MANR&E’s water policy to have rational development and
management of water. The WDD collects, processes, classifies and archives data.
The information includes hydrological, hydrogeological,
geotechnical and other data necessary for the study, maintenance and safety of
water development works. The WDD plans, designs, constructs, operates and
maintains water works. It also monitors and protects water resources from
pollution. Major studies and construction works are often subcontracted to
private firms.
At the regional level, the District Administration
(DA) under the Ministry of Interior plays a key role. The DA.
is responsible for implementing and enforcing
water-related laws including the issue of groundwater permits. The District
Officers (DO) are chairmen of District Water Boards,
Irrigation Divisions, Municipal Water Boards and Village Water Commissions.
Thus, all municipal water supplies and non-government irrigation schemes are in
principle under the jurisdiction of the Ministry of Interior.
Other
government departments as shown on the Chart, are also
involved at various aspects of the water industry of the island.
At the end-user level, a number of local institutions are
responsible for water administration at the local level. The Municipal Water
Boards and Village Commissions deal with domestic supply; the Irrigation
Divisions, Irrigation Associations, Waterworks Committees and WDD deal with
irrigation, and the Sewage Boards deal with wastewater collection and
treatment. All these organizations, except the WDD come under the Ministry of
Interior’s jurisdiction. At the user level, farmers have the right to form
Irrigation Divisions and Associations to construct and manage irrigation schemes.
An Irrigation Division is formed by landowners for sharing water whilst
water-right owners form an Irrigation Association. Villages also have the right
to establish their own commissions to develop domestic supplies from local
resources.
Any group of 10 or more landowners can form themselves
into an Irrigation Division, (under the Irrigation Divisions (Villages Law, Cap
342), in order to share amongst themselves in an agreed fashion the resources
and costs of a supply of water (well, borehole, surface reservoir, major
government reservoir etc.). The District Officer chairs the committee and the
Village Chairman is an ex officio member. There can be several Irrigation
Divisions in a village area. The committee balances its own finances and
recovers its costs from the Division members. New Irrigation Divisions are set
up as the Water Development Department implements new water schemes.
The Town Water
Boards distribute water to the domestic and industrial consumers within a town.
These are set up under the Water Supply (Municipal and Other Areas) Law, Cap
350, 1951. These derive their bulk supplies partly from boreholes and partly
from bulk supplies of treated water delivered to storage reservoirs by the
Water Development Department’s trunk main system. Their governing Boards
consist of three members nominated by the Government (the District Officer as
chairman, the Accountant General and the Director of WDD) and up to three
members from each of the municipal areas supplied by the Board. Many Municipalities
(Paphos for example) operate their own water
undertaking on the basis of own sources or from bulk supplies from the WDD,
through a committee made up from the council.
Under the Water (Domestic Purposes) Villages Supplies
Law, Cap 349, each village or part or a group of villages establish a Village
Water Committee chaired by the village chairman. This Committee manages its own
water undertaking on the basis of a spring(s), borehole(s) and some by direct
supply with bulk supplies from WDD. Individuals may drill a borehole or well on
his or someone else’s land (with their consent) and use such water for
irrigation, domestic, industrial and housing development supplies under the
Wells Law, Cap 351. A permit for the drilling as well as a
license for the use of the water are required.
Problems of present water
management set up and plans for change
Inter-agency co-operation in
managing water is as good as can be expected given the various approaches and
goals set by each participating agency. Fragmentation of responsibility has
caused many problems in all sectors. Since the WDD is responsible at the
executive level for water management, the technical situation is very good.
However, effective decision-making, implementation of works and enforcement is
made difficult because legal and management responsibilities rest with the
District Officers. These difficulties lead to considerable delays in project
authorization, implementation and overall water management.
Through various laws the
District Officer is the controlling authority at the user level. The WDD and
the Department of Agriculture assist the District Officer in an advisory
capacity on technical matters. This is not a satisfactory arrangement because
there is no single agency responsible. When there is a conflict of interest and
purpose, the technical departments are unable to implement agricultural policy
even though it should be a major criterion in irrigation works and domestic
water supply allocation
The District Officer for example is the authority by
Law issuing drilling and water use permits. Usually but not always, the advice
of the Water Development Department is requested. This has repercussions both
on the management of the aquifers but also on the agricultural activity. The
District Officer (Ministry of Interior) is the chairman of the Irrigation
Divisions and the Town Water Boards whilst the Water Development Department
representative participates in an advisory role. Although, there is generally
good cooperation amongst the District Officer and the technical Departments of
the Ministry of Agriculture, Natural Resources and Environment, on many
occasions conflict of interest does not allow clear policies to be followed
which, in turn, may not lead to sustainable management of scarce water resources.
It is broadly recognized that this dual
responsibility, especially at user level where the WDD is only an advisor, has
many disadvantages. Currently there is a decision by Government to bring this
responsibility for water under a single ministry. The Government, in 1997,
appointed the WDD as the single Water Entity responsible for water while
continuing to operate as a government department. The Water Entity is
responsible for the following activities: issuing drilling permits; groundwater
use and abstraction from all sources by any organized entities; monitoring,
control, collection and treatment of wastewater from rural, industrial and
livestock areas. The legal, financial, technical and administrative details to
implement this decision have been completed. The draft law and regulations that
modernizes the water management in full harmony with the European Union Water
Framework Directive has been submitted to the House of Representatives and
discussions are expected to be initiated on May 2002.
Management,
Institutional and policy options
The initial water policy
Water resource development in
In the 1960s the island’s water resources were
comprehensively surveyed under the “Cyprus Water Planning Project” with the FAO’s assistance. This survey paved the way for
implementation of five major development projects based on the conjunctive use
of surface and groundwater). These projects, comprising ten dams and
using a number of local aquifers, provided 170 Mm3 of water. The
water would be used to irrigate 21 000 ha and provide domestic water
to the major cities and surrounding towns and villages. To date, only 70 Mm3
have been taken up by the farmers. Present storage capacity in
The present water policy
The basic objectives of
Ø
To
secure a sustainable balance between supply and demand at the least possible
cost.
Ø
To
keep in check increasing demands for water by appropriate pricing mechanisms
and information being passed onto the end users.
Ø
To
apply irrigation water in line with the actual crops water requirements.
Ø
To
modify, as much as possible, cropping patterns in favour of crops with lower
water requirements or annual winter grown crops.
Ø
To
reduce losses from the urban water distribution systems and to increase the
efficiency of domestic water use.
Ø
To
emphasize high value crops.
The current Development Plan of the
Ø
To
complete the construction of major and secondary water works as per the
development program. In particular, the works for the combined domestic water
supply delivery to the Nicosia area and irrigation on the Tylliria
rivers in the northern part of the Troodos mountains
yielding a total yield of 18 Mm3 The remaining water development
projects are limited and therefore are not expected to augment the water supply
substantially;
Ø
To
improve the operation, maintenance and control of the water works to ensure
optimal exploitation of existing works;
Ø
To
monitor international technological developments regarding desalinating
brackish and seawater. With specific regard to how to apply such methods, reuse
treated effluent sewage and suppress evaporation from reservoirs;
Ø
To
improve the domestic supply of urban and rural areas with a view to securing at
least 180 litres per capita per day and
135 litres per capita per day respectively. In
particular to use non-conventional sources to ensure a permanent supply of
water and remove the dependency on the weather conditions;
Ø
To
promote demand management through technical and pricing mechanisms.
Ø
To
promote an institutional reorganization to allow effective management of water
resources, through the establishment of a single Water Entity;
Ø
To
protect water resources (surface and groundwater) from pollution, irrational
use and sea intrusion;
Ø
To
harmonize as much as possible
Conclusions
In
summary the following may be concluded in regard to the range of circumstances,
the regional analysis and the main issues, problems and constraints that are
pertinent to water resources and their management in the island.
Ø
Ø
The
uneven spatial and temporal distribution of rainfall and thus water resources
cause the need for the implementation of expensive water development works and
inter-basin transfers of water.
Ø
Some
60 per cent of the
Ø
There
is a pronounced seasonality of demand peaking in the summer period due to
increased irrigation requirements and influx of tourists. Certain choice
tourist destination areas experience considerable stress in meeting the water
demand. Tourism affects the demand for water and sewerage infrastructure.
Ninety-three percent of beds are concentrated along the coast. Tourist water
demand accounts for 21% of total domestic, municipal and industrial water
demand.
Ø
No
significant expansion of irrigation water demand is envisaged in the private or
communal sector. Changes however, are expected in all areas with the reduction
of low or non-profitable lemon, citrus plantations and table-grapes and their
substitution by others. It should be noted that, currently, in
Ø
The water
development in the island is approaching limiting situations since most of the
economic sites for surface water dams have been used up and additional
reservoirs have prohibitively high costs to develop.
Ø
Only improved water management and
redistribution to water conserving uses could provide additional water
resources. In addition to this, already
Ø
The
current water policy focuses on water resource management rather than on
further water infrastructure development.
Ø
As a
result of a prolonged dry period (1990 to present) but also because of
insufficient control and effective economic incentives, all the aquifers of the
island have been overexploited with the result of serious drop of water levels,
sea intrusion to various extent, diminishing of reserves and reduction of the
yield of wells. The large surface reservoir construction program has added to
the problem since the natural recharge to the coastal aquifers has been reduced
without an equal reduction of pumping.
Ø
Environmental
concerns are increasing because of the intensity of water utilization coupled
with the scarcity of water resources in the recent years. These are further
escalating due to the influx of tourism in choice areas and the general growth
of economic activities. Water quality though, of both surface and groundwater,
is generally good for domestic and irrigation uses. However, insecticide
residues and high nitrate concentrations have recently been observed in dams
and aquifers, especially where there is intensive agriculture.
Ø
The
Institutional set up as now existing is a rather complex and bureaucratic
system made up of at least four involved Ministries on the policy level, 15
Government Departments on the executive level, and a great number of
Organisations on the Water Users level either for domestic water supplies or
irrigation. New legislation for the protection of water and a new proposed law
for water resources management under one Entity together with the
implementation of the EU Water Framework directive give a new impetus to the
local efforts for water management.
Ø
Water
laws are many and complex, including duplications. These have been enacted from
time to time in the past as needs demanded, so as to cover the requirements of
various water-related interests and authorities, without ever making an effort
to group them together in an organized form or code. The recent law on the
protection of water from pollution and the bill for the establishment of a
water entity will modernize the approach to water resources management.
Ø
The
water policy is being conformed gradually to as much as possible, with that of
the European Union, taking into account the conditions prevailing in the
island. A great effort is currently being made to respond to the demanding
provisions of the Water Framework Directive and other EU legislation and
operational guidelines.
Selection of representative regions
Water scarcity or deficiency may result from a range
of phenomena. This may be produced by natural causes, such as aridity or
drought or water shortage may be induced by human activities, or may result
from an interaction of both.
Aridity is a nature produced permanent imbalance in the water
availability consisting in low average annual precipitation, with high spatial
and temporal variability, resulting in overall low moisture and low carrying
capacity of the ecosystems.
Drought is also a nature produced imbalance of water
availability but temporary, consisting of a persistent lower-than-average precipitation,
of uncertain frequency, duration and severity, of unpredictable or difficult to
predict occurrence, resulting in diminished water resources availability, and
reduced carrying capacity of the ecosystems.
Water
shortage is also a man-induced
but temporary water imbalance which may result from general excessive
exploitation of available resources such as withdrawals exceeding groundwater
recharge, or use of surface reservoirs that are of inadequate capacity and land
use change which revises the local ecosystem and alters the infiltration and
runoff characteristics. Degraded water quality is often associated with water
shortages and exacerbates the effects of water scarcity. It is important to
recognise that water scarcity can result from human activity as well, either by
over-use of the natural supply or by degradation of the water quality. This
man-induced water scarcity is common in semi-arid and sub-humid regions where
population and economic forces may make large demands on the local water resource,
and where insufficient care is taken to protect the quality of the precious
resource.
The
selection of the three candidate regions was made based on the basis of water
scarcity/ shortage or deficiency and aridity of the area, as mentioned above,
but also on its social and economic characteristics and the complexity of the
water system. Each one of these three regions suffers water deficits for a
different reason, which makes them good candidates for study. These are:
The Akrotiri aquifer area
This was the most dynamic aquifer in the island with
the annual recharge being about 32 Mm3 and the extraction amounting
to 10 to 15 Mm3. The balance was being lost to the sea and the
nearby
The groundwater levels are presently below mean sea
level throughout most of the area of the aquifer. Sea intrusion has propagated
up to 2 km and an important part of the aquifer has been rendered useless. The
reduction of replenishment (leaching effect) and the increased agricultural
activity using surface water from the Kouris dam has
caused a trend of nitrate and other elements built up in the groundwater. The
drop of the groundwater levels also affects the
Until recently a large part of the domestic water
supply of this city relied upon groundwater from this aquifer. At present, a
number of communities as well as the British Bases still pump groundwater for
their needs. The local demand for the irrigation of the citrus orchards and
seasonal crops relies on surface water from Kouris
dam, Polemidhia dam and Germasogeia
dam, local groundwater, groundwater from within the Limassol
city (high in nitrates) and tertiary treated effluent from the Limassol sewage treatment plant. Currently a sea water
desalination plant is planned to start operating by 2004 and a major artificial
recharge project using the tertiary treated effluent (up to 6 Mm3) is being set
up through recharge ponds and re-pumping for irrigation purposes.
The aquifer has excellent information for more than 30
years. It has quite a complicated water resources management system and serious
management problems to address such as environmental, quality, quantity, social
and economic. This area has permanent water shortage problems and it presents a
unique situation for integrated management application.
The Germasogeia aquifer
The Germasogeia catchment is in the southern coast of
Downstream the dam a riverbed aquifer develops. This
aquifer that is 5 km east of Limassol town has a
length of 5.5 km and an average width of about 350 m. with an active storage of
fresh water of the order of 3.5 Mm3 increasing to 5.0 Mm3 at high water table.
This small aquifer has been relied upon to meet the
major portion of the increasing demand for the water supply of the town of
The complete cut-off of the natural replenishment by
the construction of the dam and the proximity to the sea, coupled with the
increasing extraction from the aquifer, requires a coordinated programme of
releases from the dam for artificial recharge to cope with the extraction. With
such action the sea intrusion is controlled and at the same time an efficient
use of the scarce water resources is made.
The catchment area has
extensive hydro-meteorological, geological and hydrogeological
data as well sufficient surface and groundwater quality data. It constitutes an
excellent case study for conjunctive use of surface and groundwater and for
evaluating drought conditions and their repercussion to the hydrologic regime
and the socio-economic environment of the area.
The Kokkinochoria aquifer
The Kokkinochoria area is in
the South-eastern part of the island, the coastal area of which has developed
to an important tourist location. It is one of the most dynamic agricultural
regions in the country with high-income farmers. The aquifer is made up of
Miocene and Plio-Pleistocene sediments gravel, sand,
silts and calcareous matrix and blocks of reef limestone. It has an areal extent of 170 km2. The replenishment of
about 12-14 Mm3 per year was exceeded for many years by an annual
extraction of 25 Mm3. The aquifer after 35 years of extensive
development and mining presently holds some 10 to 15 % of its original
reserves. This has resulted to excessive drawdown of the water levels,
reduction in yield per well and sea intrusion.
At present, some 2500 boreholes are in operation
irrigating about 6000 hectares of mainly seasonal crops, potatoes being the main
crop with an estimated annual extraction of 10 Mm3. The yield of
these boreholes being very low at present, 1 to 7 m3/h,
is supplemented by surface water imported to the area by the Southern Conveyor
project. Under normal years some 17 Mm3 per year are envisaged to be
transferred in the area from the Kouris dam, some 70
km to the west. In the last 10 years though due to a prolonged drought the
quantity of water imported to the area annually has been less than 5 Mm3.
With a drop of the water-table averaging to 1.5 m/y
for the last 30 years, the water-table in many areas especially near the coast
is located down to 40-50 m below mean sea level. The thickest and most
productive part of the aquifer, being within 3 km from the coast has
practically been sea-intruded and rendered useless.
The water deficiency problems of this area need to be
addressed and alternative sources of supply, water demand management practices,
change of cropping pattern and other similar issues need to be considered.
The Akrotiri area covers the
Akrotiri peninsula and it is the southernmost part of
the island (see Map 3.1) .It covers an area of 142 sq. km. Its eastern part is
taken over by the urban area of Limassol with some
125000 inhabitants. There are 10 other village communities with a total
population of 16000 within the same area that basically may be considered as
suburbs to Limassol with their inhabitants commuting
to the city and also working as farmers within the general area.
At the southern tip of the peninsula there is a major
British military base with an airfield and an estimated force of the order of
15000 soldiers with their families. This
is separated from the agricultural land and aquifer further to the north, by a
The aquifer, the third largest in the island,
essentially is a gently dipping coastal deltaic alluvial aquifer of a 40-km2
extent. Its western half coincides with the alluvial fan deposits of the
The main source of the natural recharge of the
aquifer, after the construction of Polemidia dam in
1965 on Garyllis river and
the construction of the Kouris dam in 1987 on Kouris river changed dramatically. It now depends entirely
on local rainfall of about 380 to 430 mm, return flow from imported water for
irrigation and on artificial groundwater recharge.
Sea intrusion was originally confined at the eastern
part but more recently, and after the construction of the Kouris
dam of 115 Mm3, a large part of the Kouris delta area
has also been sea-intruded. Ongoing artificial groundwater recharge with water
from the surface reservoirs, and planned with treated effluent, together with
further control of pumping is expected to reverse the situation. Furthermore,
with the reduction of the flashing effect of the annual recharge together with
the increased agricultural activity, a gradual built up of nitrate and other
elements has been noted in the groundwater of the area.
Presently the irrigation requirements of the area are
met by local groundwater, tertiary treated effluent, surface
water from the Kouris, Germasogeia
and Polemidhia dams and from reclaimed groundwater
pumped from within the Limassol urban area. The area
irrigated at present is 2200 ha with a demand of 15 Mm3, out of a planned area of
3775 ha. The Limassol domestic supply is mainly
provided from the Kouris dam and partly from
groundwater from the Germasogeia aquifer.
A major desalination plant of 20000-m3/d capacity is
planned for commissioning by 2004 to be built at the western part of the area.
The aquifer is very well controlled. The groundwater
levels are observed monthly from a network of 150 since 1960, 85 to 100 of
which are regularly sampled. The
groundwater pumping is quite well monitored through water meters that are
observed every month. The area is well surveyed and studied. A good database
exists and numerous studies have been performed including groundwater modeling.
Low rainfall and reduction of the surface reservoir
water content resulted to diminished recharge, both natural and artificial, of
the aquifer. This together with the continued extraction pattern of pre-dam
construction has caused a serious drop of the groundwater levels (Fig. 3.1 and
Map 3.2) and sea intrusion (Map 3.3).

Map 3.1: Akrotiri Aquifer showing inhabited areas and well
observation network
The intensive use of fertilizers in agriculture
together with the reduction of the flashing effect by natural recharge resulted
to a nitrate built-up in the aquifer. The concentration of nitrate ion in the
eastern part of the aquifer is in excess of 200 mg/l.
At the same time the diminished flows of

Figure
3.1:
Hydrograph of borehole Akrotiri 775 (Elev. 15.63 m amsl)

Map
3.2: Akrotiri Aquifer - Water Level (m amsl)
Contour Map March 2001
Anthropogenic intervention has changed dramatically
the hydrologic regime in the area especially after the construction of the Kouris dam. The average water balance over the period of 1967/68 –
1976/77 compared to present conditions is shown on the Table below (All in Mm3/yr):
|
RECHARGE |
Kouris dam was constructed in 1987 |
Rainfall |
Riverbed Recharge |
Subsurface Inflow |
Sea intrusion |
Return from irrigation |
Return imported / Diversions |
Artificial Recharge |
Total |
Remarks |
|
Before
(1968-1978) |
5.9 |
15.4 |
4.2 |
0.7 |
4.5 |
3.5 |
|
34.2 |
Average
rainfall 395 mm |
|
|
At
present |
4.2 |
0.5 |
0.2 |
3.0 |
1.1 |
0.7 |
3.3 |
13.0 |
Average
rainfall 380 mm |
|
OUTFLOW |
|
Abstraction for irrigation and domestic |
Evapotranspiration |
Rising water
|
Sea/Lake Outflow |
Total |
Remarks |
|
Before
(1968-1978) |
14.5 |
2.5 |
2.2 |
16.0 |
35.2 |
|
|
|
At
present |
10.8 |
2.4 |
0.3 |
0.5 |
14.0 |
|
From the balance above one should note the very small
quantity of groundwater that outflows from the system at present and which does
not provide the required leaching effect, the reduction of rising water that
affects the marshland, and the increase in sea intrusion quantities which
although they are considered as part of the “recharge”, the resulting true
balance is in effect negative and of the order of 4 Mm3 per
year.

Map
3.3: Akrotiri Aquifer - Isochloride
(ppm) Contour Map April 2001
Table 3.1 : Akrotiri
Area Matrix
|
Natural conditions and infrastructure |
Regional Context |
Climate Type |
Csa-Mediterranean |
|
Aridity Index |
Semi-arid
(0.330) |
||
|
Permanent Population |
156000 |
||
|
Water availability |
Total Water Resources /Availability |
30 Mm3 |
|
|
Trans-boundary water |
- |
||
|
Water quality |
Quality of surface water |
Very Good |
|
|
Quality of groundwater |
Fair - Poor |
||
|
Quality of coastal water |
Good |
||
|
Water Supply |
Percentage of
supply coming from:
Groundwater
Surface water
Desalination, Recycling
Importing |
|
|
|
33% |
|||
|
62% |
|||
|
5% |
|||
|
|
|||
|
Network
coverage:
Domestic
Irrigation
Sewerage |
|
||
|
100% |
|||
|
>85% |
|||
|
Apx. 75% |
|||
|
Economic and Social issues
|
Water use |
Water
consumption by category:
Domestic
Tourism
Irrigation
Industrial and energy production |
|
|
30% |
|||
|
10% |
|||
|
60% |
|||
|
|
|||
|
Resources to population index |
192 m3/c |
||
|
Water demand |
Water Demand trends |
Increasing |
|
|
Consumption index |
100% Increasing |
||
|
Exploitation index |
100% Increasing |
||
|
Pricing system |
Average household budget for domestic water |
€ 99.2/yr * |
|
|
Average
household budget for agricultural water |
€0.11/m3 depends
on land |
||
|
Average household income |
€24207urban* €18488 rural* |
||
|
Cost recovery |
Dom €0.58/m3
Full Financial Irr €0.11 O&M |
||
|
Price elasticity |
Very small |
||
|
Social Capacity building |
Public participation in decisions |
Fair |
|
|
Public education on water conservation issues |
Fair |
||
|
Decision Making Process |
Water Resources Management |
Water ownership |
State- (partly
private) |
|
Decision making
level (municipal, regional, national) regarding: Water supply for each sector |
National |
||
|
Water resources
allocation for each sector |
National |
||
|
Water Policy |
Local economy basis |
Agri/tertiary |
|
|
Development priorities |
Agri/tourism |
Aridity = 407/(4.5x365x.0.75) .. 1961-1990
* Family Budget
Survey 1996/97 Statistical Service of
Germasogeia Area
The Germasogeia catchment is in the southern coast of
|
Germasogeia Watershed (in relation to Dam) |
ANNUALLY AND SEASONALLY IRRIGATED CROPS (in hectares and Mm3)
|
|||||||
|
RIVER |
SPRINGS |
WELLS/BH |
TOTAL |
|||||
|
Area |
Water Use |
Area |
Water Use |
Area |
Water Use |
Area |
Water Use |
|
Upstream
|
295 |
2.5 |
78 |
0.8 |
16 |
0.2 |
386 |
3.5 |
Downstream
|
304 |
3.0 |
|
|
|
|
304 |
3.0 |
There are 14 village communities within the watershed
with a total permanent population of just over 10000 and water demand of 0.5 to
0.7 Mm3 per year, of which 12 villages are upstream the dam with a
population of about 4000. There is considerable tourist development at the
coastal area with an estimated 0.5 million-guest nights and a water demand of
0.9 Mm3 during the tourist season.
Downstream the dam a riverbed aquifer develops. This
is a typical
river alluvial aquifer.
This aquifer, which is 5 km east of Limassol town (Map 4.1), has a length of 5.5 km and an
average width of about 350 m. This phreatic aquifer
consists of sandy gravels with low silt content except towards the coast where
an increase of finer material is noted. The thickness in the deepest part
varies from 35 meters near the dam to 50 meters near the coast. The
permeability in the upstream part of the aquifer is as high as 300 m/d reducing
to 100 near the Delta. The specific yield varies from 13 to 22%. The active
storage of fresh water is of the order of 3.5 MCM increasing to 5.0 MCM at high
water table.

Map 4.1 Location of the Germasogeia watershed (the part downstream the dam)
The small aquifer between the surface reservoir and up
to 4 km downstream, before the development of the Delta area, has been relied
upon to meet the major portion of the increasing demand for the water supply of
the town of
Since the
construction of the dam in 1968 the recharge of the aquifer depends on
controlled releases from the dam and its spills. During the last ten years the
dam spilled only twice, in 1993 and 1995.
The complete cut-off of natural replenishment by the
construction of the dam and the proximity to the sea, coupled with the
increasing extraction from the aquifer, requires a coordinated programme of
releases from the dam for artificial recharge to cope with the extraction. With
such action the sea intrusion is controlled and at the same time an efficient
use of the scarce water resources is made.
The need for controlled releases from the dam to artificially
recharge this aquifer through flooding in the active channel became a necessity
by 1982 due to the increasing demand for domestic supply and the rather dry
conditions experienced at the time. This conjunctive use of the surface and
groundwater reservoirs enabled a dramatic increase in the extraction from this
aquifer deferring the need for an expensive treatment plant for many years.
The extraction was doubled due to an equivalent
increase of recharge. It is important to note that with the regulated releases
of water and the resulting recharge the annual extraction in many years was
about three times the active storage of the riverbed aquifer.
In the early days of the recharge, large quantities
were released at irregular time intervals. Gradually, the daily release
quantities were being reduced and the length of the period of release was
increased.
Since 1986, the release is practically continuous and
at such rates that the losses to the sea through the subsurface are minimal.
The rates of release are of the order of 15 to 25 000
m3/d whilst the total groundwater inflow to the main well-field
serving Limassol is in the range of 18 to 30 000 m3/hr.
Chemically the groundwater is similar to that of the
water in the surface reservoir. Bacteriological analyses from all the boreholes
show that the 10 to 20 meters of unsaturated thickness of alluvial sediments
provides an efficient protection to bacteriological pollution.
In the Delta area and near the coast the interface has
remained practically stable showing that the recharge-extraction regulation has
been of the correct order without excessive pumping or serious subsurface loss
of fresh water to the sea.
In effect the
small Germasogeia riverbed aquifer has been turned
into a natural treatment plant for domestic water supply without the need of
complicated and expensive surface water treatment requiring chemicals,
qualified technical and managerial personnel and the necessary civil
engineering structures. Surface water from the Germasogeia
and Kouris dams is being released in the riverbed
since 1982 for recharge of the aquifer. Groundwater is pumped for the domestic
water supply of the Limassol town, for the
surrounding villages, and the tourist zone. This aquifer is the only source of
domestic water supply of the local village communities and the tourist zone.
The catchment area has
extensive hydrometeorological, geological and hydrogeological data as well sufficient surface and
groundwater quality data. It constitutes an excellent case study for evaluating
drought conditions and their repercussions on the hydrologic regime and to the
socio-economic environment of the area. In the aquifer area some 46 boreholes
are monitored every 15 days and conductivity logs are kept for 10 boreholes for
monitoring the sea/fresh water interface. The extraction from all wells and
boreholes is monitored monthly my water-meters. The releases for recharge are
monitored on a daily basis. A good database and GIS as well as groundwater
models exist for the area.
The Germasogeia water
resources system (surface reservoir and aquifer) is the most intensively
exploited one in the island. In 1996 up to 9 Mm3 of groundwater were
extracted from this small aquifer, whose area is only 3 km2 and its
total fresh water capacity at average groundwater level conditions, is in the
order of only 3.5 Mm3.
A fast growing urbanization within the aquifer area
and tourist development is causing concern about the environmental impact and
possible deterioration of the quality of groundwater in this highly susceptible
aquifer.
The hydrogeological regime
and the water balance of the aquifer are “regulated” by controlled releases
from the dam into the river valley. The main targets are:
a)
To cover water demand with
groundwater of acceptable quality,
b)
To protect the aquifer from
sea intrusion,
c)
To minimize groundwater losses
to the sea and to
d)
Maximize the water
availability through conjunctive use of surface and groundwater.
Some 23 boreholes operate in the aquifer today for
domestic water supply. The yields of these boreholes vary from 50 to 200 m³/hour. Annually, the average extraction is about 6
Mm3, whilst the average artificial recharge is about 5 Mm3.
The water balance of the aquifer is quite good and no
problems of sea intrusion are faced provided there is ample water in the
surface reservoir for recharge and the groundwater extraction is contained
within the capabilities of the system.
The sustainable extraction under natural conditions
i.e. with no artificial recharge of the aquifer is estimated to be of the order
of 1.4 Mm3/year based mainly on the leakages from the dam.
Map 4.2 shows the location of the surface reservoir and the aquifer whilst Figure 4.1 shows a typical groundwater level fluctuation. The cycles of increased recharge or extraction are quite obvious on this hydrograph. Map 4.3 shows the groundwater contours in the area, especially as these develop around the main well-fields and near the coast.
|
RECHARGE |
Germasogeia dam
(13Mm3) was constructed in 1968 |
Rainfall and
Return from irrigation /domestic |
Riverbed Recharge |
Leakage from dam |
Sea intrusion |
Artificial Recharge |
Total |
Remarks |
|
(1982– 1987) average
rainfall 430 mm |
0.4 |
0.5 |
1.8 |
0.0 |
3.6 |
6.3 |
By
A. Christodoulides |
|
|
(1991-2000)
average rainfall 400 mm |
0.5 |
|
1.0 |
0.1 |
5.1 |
6.7 |
By
A. Georgiou |
|
OUTFLOW |
|
Abstraction for domestic |
Sea Outflow |
Total |
Remarks |
|
(1982– 1987) average
rainfall 430 mm |
5.6 |
0.7 |
6.3 |
By
A. Christodoulides |
|
|
(1991-2000)
average rainfall 400 mm |
6.4 |
0.3 |
6.7 |
By
A. Georgiou |

Map 4. 2: Germasogeia Riverbed Aquifer - Location Map

Figure
4. 1 : Hydrograph of borehole
Germasogeia 1077 (Elev. 4.98 m amsl)

Map
4. 3: Germasogeia Riverbed
Aquifer Water Level (m amsl) Contour Map November
2001
Table 4.1 : Germasogeia
Area Matrix
|
Natural conditions and infrastructure |
Regional Context |
Climate Type |
Csa- Med/ean |
|
Aridity Index |
Semi-arid
(0.356) |
||
|
Permanent Population |
10000 |
||
|
Water availability |
Total Water Resources /Availability |
20/12 Mm3 |
|
|
Trans-boundary water |
- |
||
|
Water quality |
Quality of surface water |
Very Good |
|
|
Quality of groundwater |
Very Good |
||
|
Quality of coastal water |
Good |
||
|
Water Supply |
Percentage of
supply coming from:
Groundwater
Surface water
Desalination, Recycling
Importing Exporting |
|
|
|
15% |
|||
|
50% |
|||
|
35% |
|||
|
|
|||
|
Network
coverage:
Domestic
Irrigation
Sewerage |
|
||
|
100% |
|||
|
>70% |
|||
|
Apx. 80% |
|||
|
Economic and Social issues
|
Water use |
Water
consumption by category:
Domestic
Tourism
Irrigation
Industrial and energy production |
|
|
0.6 Mm3 |
|||
|
0.9 Mm3 |
|||
|
6.5 Mm3 |
|||
|
|
|||
|
Resources to population index |
1200 m3/c |
||
|
Water demand |
Water Demand trends |
Increasing |
|
|
Consumption index |
67% increasing |
||
|
Exploitation index |
67% Increasing |
||
|
Pricing system |
Average household budget for domestic water |
€ 99.2/yr * |
|
|
Average
household budget for agricultural water |
€0.11/m3 depends
on land |
||
|
Average household income |
€24207urban* €18488 rural* |
||
|
Cost recovery |
Dom €0.58/m3
Full Financial Irr €0.11 O&M |
||
|
Price elasticity |
Very small |
||
|
Social Capacity building |
Public participation in decisions |
Fair |
|
|
Public education on water conservation issues |
Fair |
||
|
Decision Making Process |
Water Resources Management |
Water ownership |
State- (partly
private) |
|
Decision making
level (municipal, regional, national) regarding: Water supply for each sector |
National |
||
|
Water resources
allocation for each sector |
National |
||
|
Water Policy |
Local economy basis |
Agri/tertiary |
|
|
Development priorities |
Agri/tourism |
Aridity = 478/(4.9x365x.0.75) .. 1961-1990
* Family Budget
Survey 1996/97 Statistical Service of
Kokkinochoria Region
The area
includes five village communities and three municipalities with a total
permanent population of 30000 and an annual water demand in excess of 1.7 Mm3.
Two areas near the coast (Paralimni and Agia Napa) have developed to a very attractive tourist
resort with tourists exceeding 6 million-guest nights and a water demand of
about 3 Mm3.
The Kokkinochoria area being at the lee-side and far from the
The local
aquifer has been overexploited since the early 1960s and the groundwater mined
is in excess of 350 Mm3. At present the groundwater reserves are
only 15% of the original. Water levels in the aquifer within 2 km from the
coast have dropped to 50 m below mean sea level.
The region is
an early-potato producing area with most of the produce being exported to the
There exists
good hydrogeological information for the area with
some 164 wells being monitored for water levels since 1964 every three months
(see Map 5. 2 and Figure 5.1). Water quality surveys are carried out seasonally
to check the propagation of the sea-intrusion (see map 5.3).
In the Table
that follows an estimated water balance of the Kokkinochoria aquifer is presented for two periods: 1963-78
and for 1990 to present.

|
RECHARGE |
Southern
Conveyor Project completed in 1987 |
Rainfall |
Subsurface Inflow |
Sea intrusion |
Return from irrigation |
Return imported / Diversions |
Total |
Remarks (aquifer
area 172 sq. km) |
|
1963-1978 (SCP study – Iacovides) |
8.2 |
1.1 |
2.9 |
4.7 |
|
16.9 |
Average
rainfall 330 mm |
|
|
At
present (FAO study – Georgiou) |
8 |
0.1 |
5.5 |
0.5 |
1.6 |
15.7 |
Average
rainfall 300 mm |
|
OUTFLOW |
|
Abstraction for irrigation and domestic |
Sea Outflow |
Total |
Balance |
|
1963-1978 (SCP study – Iacovides) |
27.1 |
0.4 |
27.5 |
–10.6
|
|
|
At
present (FAO study – Georgiou) |
14.0 |
1.5 |
15.5 |
+
0.2 * |
The recommended annual pumping from this aquifer is
only 8 Mm3.
The most productive parts of the aquifer (Ormidhia, Xylophagou, Liopetri, Phrenaros), have been
sea intruded and abandoned since the early 1980s. The less productive parts are
already depleted with dramatically reduced borehole yield.
It is estimated that over 5000 boreholes operate in
the area today. Yields of these boreholes have reduced from an average of 10 m³/hour in 1980 to 1 to 2 m³/hour in 2000. Boreholes
with yields of 2-3 m³/day are still in operation. In effect the farmers are
rapidly and inexorably drying out the aquifer. A rough estimate of the average
annual extraction during the past 10 years is estimated to be around 12 to 14
Mm3.

Figure 5.1: Hydrograph of boreholes Xylophagou
66 and Liopetri 469 (Elev. 52.61 and 30.74m amsl)

Map 5.2: Kokkinochoria
Aquifer - Water Level (m amsl) Contour Map Sept. 2000

Map 5. 3. Kokkinochoria
Aquifer Isochloride contours (ppm)
for June 1994 (after Georgiou
Table5. 3 : Kokkinochoria
Area Matrix
|
Natural conditions and infrastructure |
Regional Context |
Climate Type |
Csa-Med/nean |
|
Aridity Index |
Semi-arid
(0.268) |
||
|
Permanent Population |
30000 |
||
|
Water availability |
Total Water Resources /Availability |
30 Mm3 ** |
|
|
Trans-boundary water |
- |
||
|
Water quality |
Quality of surface water |
Very Good |
|
|
Quality of groundwater |
fair |
||
|
Quality of coastal water |
Good |
||
|
Water Supply |
Percentage of
supply coming from:
Groundwater
Surface water
Desalination, Recycling
Importing |
|
|
|
30% |
|||
|
- |
|||
|
13% |
|||
|
57% |
|||
|
Network
coverage:
Domestic
Irrigation
Sewerage |
|
||
|
100% |
|||
|
>85% |
|||
|
Apx. 70% |
|||
|
Economic and Social issues
|
Water use |
Water
consumption by category:
Domestic
Tourism
Irrigation
Industrial and energy production |
|
|
6% |
|||
|
10% |
|||
|
84% |
|||
|
|
|||
|
Resources to population index |
1000 Mm3/c
** |
||
|
Water demand |
Water Demand trends |
Increasing |
|
|
Consumption index |
100%Increasing |
||
|
Exploitation index |
300%Increasing |
||
|
Pricing system |
Average household budget for domestic water |
€ 99.2/yr * |
|
|
Average
household budget for agricultural water |
€0.11/m3 depends
on land |
||
|
Average household income |
€24207urban* €18488 rural* |
||
|
Cost recovery |
Dom €0.58/m3
Full Financial Irr €0.11 O&M |
||
|
Price elasticity |
Very small |
||
|
Social Capacity building |
Public participation in decisions |
Fair |
|
|
Public education on water conservation issues |
Fair |
||
|
Decision Making Process |
Water Resources Management |
Water ownership |
State- (partly
private) |
|
Decision making
level (municipal, regional, national) regarding: Water supply for each sector |
National |
||
|
Water resources
allocation for each sector |
National |
||
|
Water Policy |
Local economy basis |
Agri/tertiary |
|
|
Development priorities |
Agri/tourism |
Aridity =( (350+318+330)/3)/((4.6+4.4+4.6)/3)x365x.0.75) ..
1961-1990
* Family Budget
Survey 1996/97 Statistical Service of
** Includes import
by SCP (17Mm3), local groundwater (9 Mm3) and
Desalination (4 Mm3)
Exploitation index
= 300% since 30Mm3 are used against 10Mm3 locally
available